RHEA price prediction talk picked up fast this week. The token traded near $0.08468 as of 10:34 UTC on September 25, 2026, up sharply on the day. Anyone scanning acrypto price prediction hub
RHEA price prediction talk picked up fast this week. The token traded near $0.08468 as of 10:34 UTC on September 25, 2026, up sharply on the day.
Anyone scanning acrypto price prediction hub right now would spot RHEA sitting near the top of the movers list.
24-hour gains sit between 57.5% and 57.73%, depending on the source checked. That's a steep climb.
The move followed a breakout from a long consolidation range that had capped the token for months. Volume spiked hard on the way up.
FullRHEA market data on CoinGecko shows the coin swinging from a 24-hour low of $0.05266 to a high of $0.09007.
Product news added fuel too. Rhea Finance has been shipping cross-chain swap features and teasing new launches through late September 2026.
This piece covers the next seven days and the one-month outlook, built off the latest trading chart, on-chain holder data, and recent project updates.
RHEA Price Prediction: Quick Outlook
Metric
Current Outlook
Current Price
$0.08468 (as of 10:34 UTC, Sep 25, 2026)
24H Change
+57.5%
Market Cap
$34.53M
24H Volume
$6.14M
Trend
Bullish, short-term overheated
Next Target
$0.09192
Support
$0.07000 (immediate) / $0.05266 (stronger)
Resistance
$0.09192 (immediate) / $0.12516 (major)
RSI (14)
67.43
MACD
Bullish
7-Day Outlook
Cautiously bullish, watching resistance
1-Month Outlook
Mixed, dependent on volume follow-through
Technical Analysis: What Is Driving RHEA Price Right Now?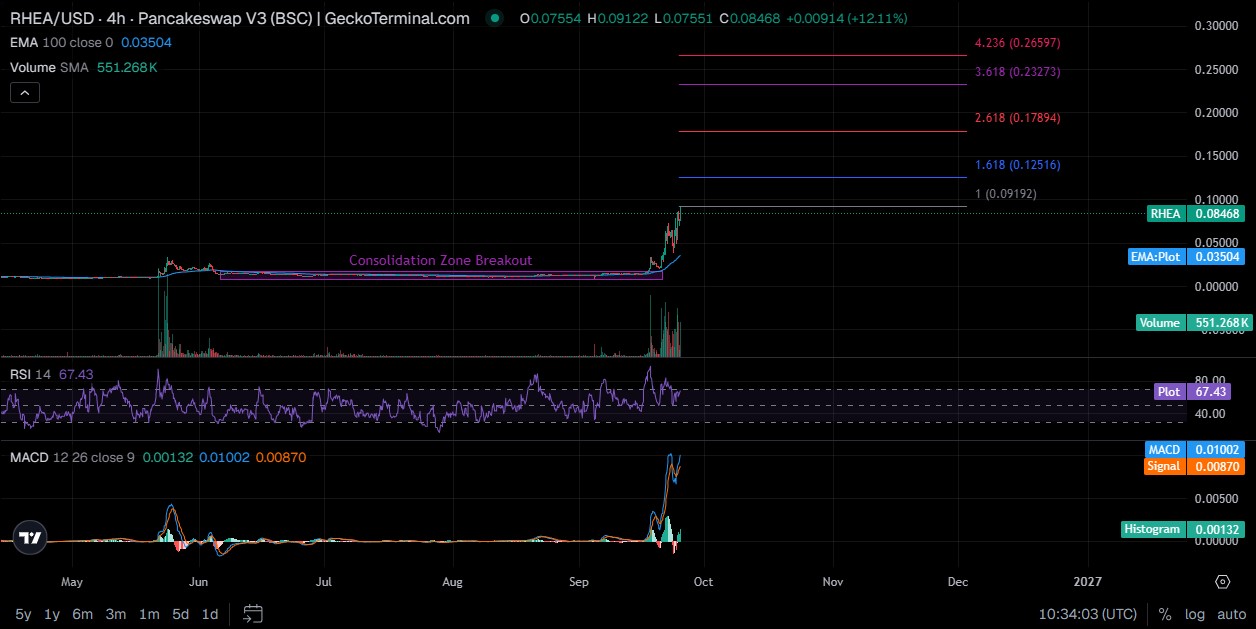
The RHEA price surge traces back to a breakout above a multi-month consolidation zone visible on theRHEA/USD live chart. Price had been pinned between roughly $0.02 and $0.05 since June.
Volume tells the real story here. The token's volume simple moving average sits at 551.268K, and recent candles show trading volume running well above that baseline.
On decentralized exchange data, buy pressure outweighs sell pressure by a thin margin: 3,889 buy transactions against 4,411 sells, yet net flow still favors buyers at roughly +$108,390 over 24 hours.
Sentiment matters too. Broader AI sector crypto news and DeFi rotation narratives have been pulling capital toward smaller-cap tokens with fresh product news.
And Rhea Finance has news to point to. The project confirmed a Confidential Swap 2.0 feature and a NearKat token listing in the days leading into this rally.
But short-term momentum reads hot. The one-hour change actually sits at negative 4.65%, a sign some of the fastest money already took profit.
What Does the $RHEA Chart Say for the Next 7 Days?
RHEA Support and Resistance Levels
Immediate support sits near $0.07000, roughly where the breakout candle opened before the vertical push.
Stronger support sits at the 24-hour low of $0.05266, close to the top of the old consolidation range.
Immediate resistance lines up with the Fibonacci 1.0 extension at $0.09192, just above the current trading price.
Major resistance is the 1.618 extension near $0.12516. That level has not been tested since the breakout began.
RSI, MACD, and Volume Signals
RSI reads 67.43 on the 14-period setting. That's elevated, close to the overbought line at 70, but not fully extended yet.
MACD sits at 0.01002 against a signal line of 0.00870, a positive spread with a histogram of 0.00132. That's a bullish reading.
Here's the thing: momentum indicators and price both point up, but they moved fast. Fast moves can reverse just as fast.
Volume does confirm the move for now. The breakout candle carried trading volume far above the recent average, which is what a real breakout needs.
$RHEA Breakout and Breakdown Levels
A confirmed close above $0.09192 on strongon-chain holder distribution support would open the path toward $0.12516.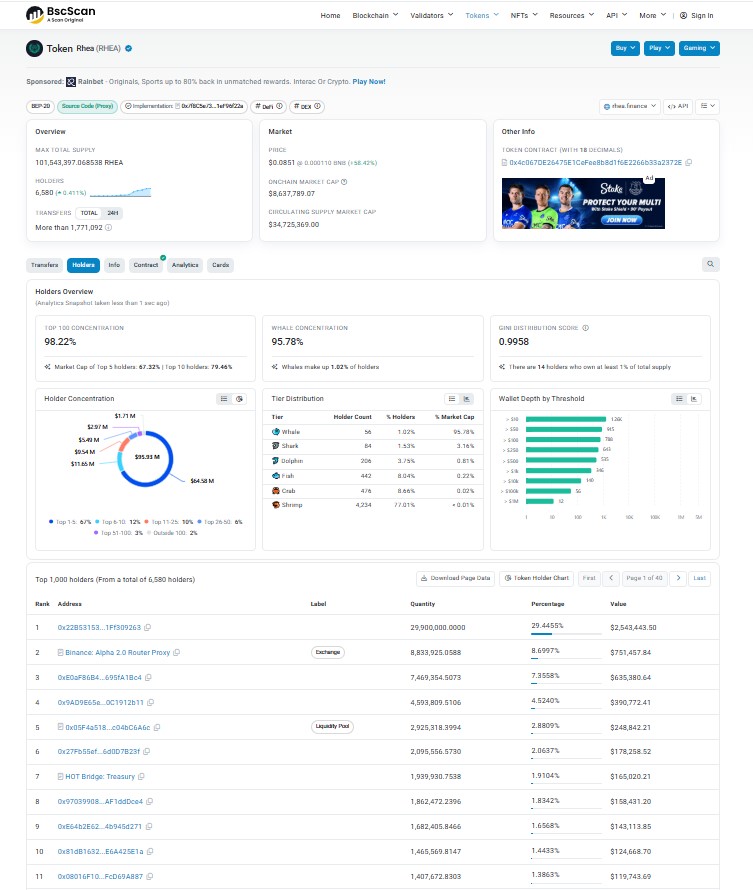
That would mark the next upside target if buyers keep control through the week.
A break below $0.05266, on the other hand, would signal fading strength. Trading below that level for more than a session or two.
The downside target in that case sits near the EMA100 line, currently around $0.03504. That's a long drop from current trading levels.
Can $RHEA Break the Next Resistance Level?
Current resistance sits at $0.09192, only a short distance from the $0.08468 trading price recorded at the snapshot time.
That's roughly eight percent away. Not far. But getting there on rising volume is a different question than just drifting close.
Confirmation needs trading volume to stay above the 551K SMA baseline through at least two or three more four-hour candles.
If that holds, the next target becomes the 1.618 extension at $0.12516, a level tied to the token's broaderlong-term RHEA forecast.
What would break the setup? A fade back under $0.07000 on falling volume would undo the bullish read fast.
Turns out, resistance breaks rarely happen on the first attempt. Worth remembering before assuming this one will be different.
What Could Happen to $RHEA Over the Next Month?
Scenario
Possible Range
Key Driver
Invalidation
Bull
$0.095–$0.125
Breakout above $0.09192 with strong volume, new product launches
Trading below $0.070
Base
$0.060–$0.090
Range-bound consolidation after the initial spike
Extended move outside range for several days
Bear
$0.035–$0.055
Breakdown below $0.0527, whale profit-taking, wider market weakness
Reclaiming $0.075 with volume
These are scenarios, not guarantees. Markets tied to thin liquidity, like tokens still active oncrypto presale and IDO calendars, can swing between these ranges quickly.
Key RHEA Levels Traders Should Watch
Level
Price
Why It Matters
Support
$0.05266
Holds the current breakout structure
Resistance
$0.09192
First upside barrier after the rally
Breakout
$0.09192+ (on volume)
Confirms stronger momentum toward $0.12516
Breakdown
Below $0.05266
Signals weakness, opens path to EMA100
Invalidation
$0.07000
Weakens the current bullish structure
What Could Move $RHEA Price Next?
Product momentum stands out first. Rhea Finance has been active on cross-chain swap tools and new token listings tied tocrypto exchange listing coverage across the sector.
A teased "quantum-secure money" feature, mentioned in a recent post from the project, could act as a fresh catalyst if details land soon.
Traders tracking upcoming milestones may want acoin events calendar alongside the chart, since listings and feature launches tend to move thinly traded tokens hard.
Whale concentration is the risk to flag. On-chain data shows the top 100 holders control 98.22% of supply, with whales alone holding 95.78%. That's an extreme concentration score.
A Gini distribution score of 0.9958 confirms it. One large wallet move could swing the price outside any of the ranges listed above.
Broader Bitcoin direction and general risk sentiment still matter for a token this size. And community-driven flows, includingcrypto airdrop campaigns, can pull short-term attention toward or away from RHEA.
RHEA Price Prediction: Trader Takeaway
The trend has turned bullish after a long consolidation phase, and trading volume has backed the move so far.
The most important support to watch sits at $0.05266. Losing it would undercut the entire breakout thesis.
The most important resistance is $0.09192. Clearing it on strong volume opens room toward $0.12516.
A bullish trigger looks like sustained trading above $0.09192 with volume holding near or above the SMA baseline. A bearish trigger looks like a fade under $0.07000, especially paired with whale wallet outflows.
Traders may watch whether $RHEA holds $0.070 and breaks $0.092 with stronger volume before adding exposure. Extreme holder concentration remains the wildcard worth tracking through thelatest crypto market news cycle.
The setup is bullish for now, but it's a fragile kind of bullish.
Disclaimer
This article is for informational purposes only and does not constitute financial, investment, or trading advice. Cryptocurrency markets, including $RHEA, carry high volatility and risk, particularly given the token's concentrated holder base. Data points referenced were accurate as of the stated snapshot time and can change quickly. Independent research and professional financial guidance are recommended before making any trading decisions.