A quiet Solana altcoin just woke up overnight, and the chart tells a story most holders weren't expecting this week. Something shifted between the sellers and buyers, and the shift wasn't sma
A quiet Solana altcoin just woke up overnight, and the chart tells a story most holders weren't expecting this week. Something shifted between the sellers and buyers, and the shift wasn't small. Before you scroll past another green candle screenshot, there's a real question worth asking here: is this the start of something, or just another trap before the next leg down?
Why Seeker's Sudden Move Has Traders Paying Attention
The Seeker price prediction starts with a simple fact: nobody was talking about this token a week ago. Then the chart broke a pattern it had been stuck in for months. It's the kind of move that gets screenshotted and shared before anyone actually knows why it happened.
Here's the thing: sharp moves like this usually come from one of two places. Either real usage is picking up, or a wave of short sellers just got squeezed out at once. Turns out, with Seeker, both stories are playing out at the same time.
We've seen this setup before with other Solana ecosystem tokens. A quiet base, a sudden volume spike, then a scramble to figure out if it's sustainable, and you can browse similar setups across theprice prediction hub for comparison. Is it different this time? That's the part nobody can answer yet.
Table of Contents
Quick Answer: SKR Price Direction Right Now
Seeker Price Prediction Key Takeaways
Why Is Seeker (SKR) Price Up Today?
SKR Technical Analysis: Daily Chart
SKR Technical Analysis: Weekly Chart
Is Seeker (SKR) a High-Risk Altcoin?
Seeker Tokenomics and Unlock Risk
Seeker Price Prediction: Bull, Base and Bear Cases
24-Hour and 7-Day Outlook
Seeker Price Prediction 2026
What Could Push SKR Lower
Glossary
Quick Answer: SKR Price Direction Right Now
As of August 5, 2026, 07:00 UTC, Seeker (SKR) trades near $0.00951, up roughly 52% over 24 hours, according to CoinMarketCap. The immediate trend is bullish after price broke out of a multi-week descending channel. Key resistance sits at $0.01007, with a bigger wall near $0.01283. Immediate support sits at $0.00620, and the base case here leans cautiously bullish as long as $SKR holds above that support zone. A daily close back under $0.00620 would invalidate the breakout thesis.
Seeker Price Prediction Key Takeaways
SKR broke out of a descending channel on both the daily and weekly timeframes.
24-hour volume jumped over 1,244% alongside the price move, per CoinMarketCap.
Daily RSI sits at 66.41, approaching overbought but not extreme yet.
Weekly RSI is still under 40, meaning the bigger downtrend isn't fully reversed.
Short positions took the brunt of recent liquidations, based on CoinGlass data.
Price remains 82.89% below its January 2026 all-time high.
Why Is Seeker (SKR) Price Up Today?
This Seeker price prediction can't ignore what's actually driving the tape. Trading volume hit $31.43 million in 24 hours, a massive jump from prior days, per CoinMarketCap figures.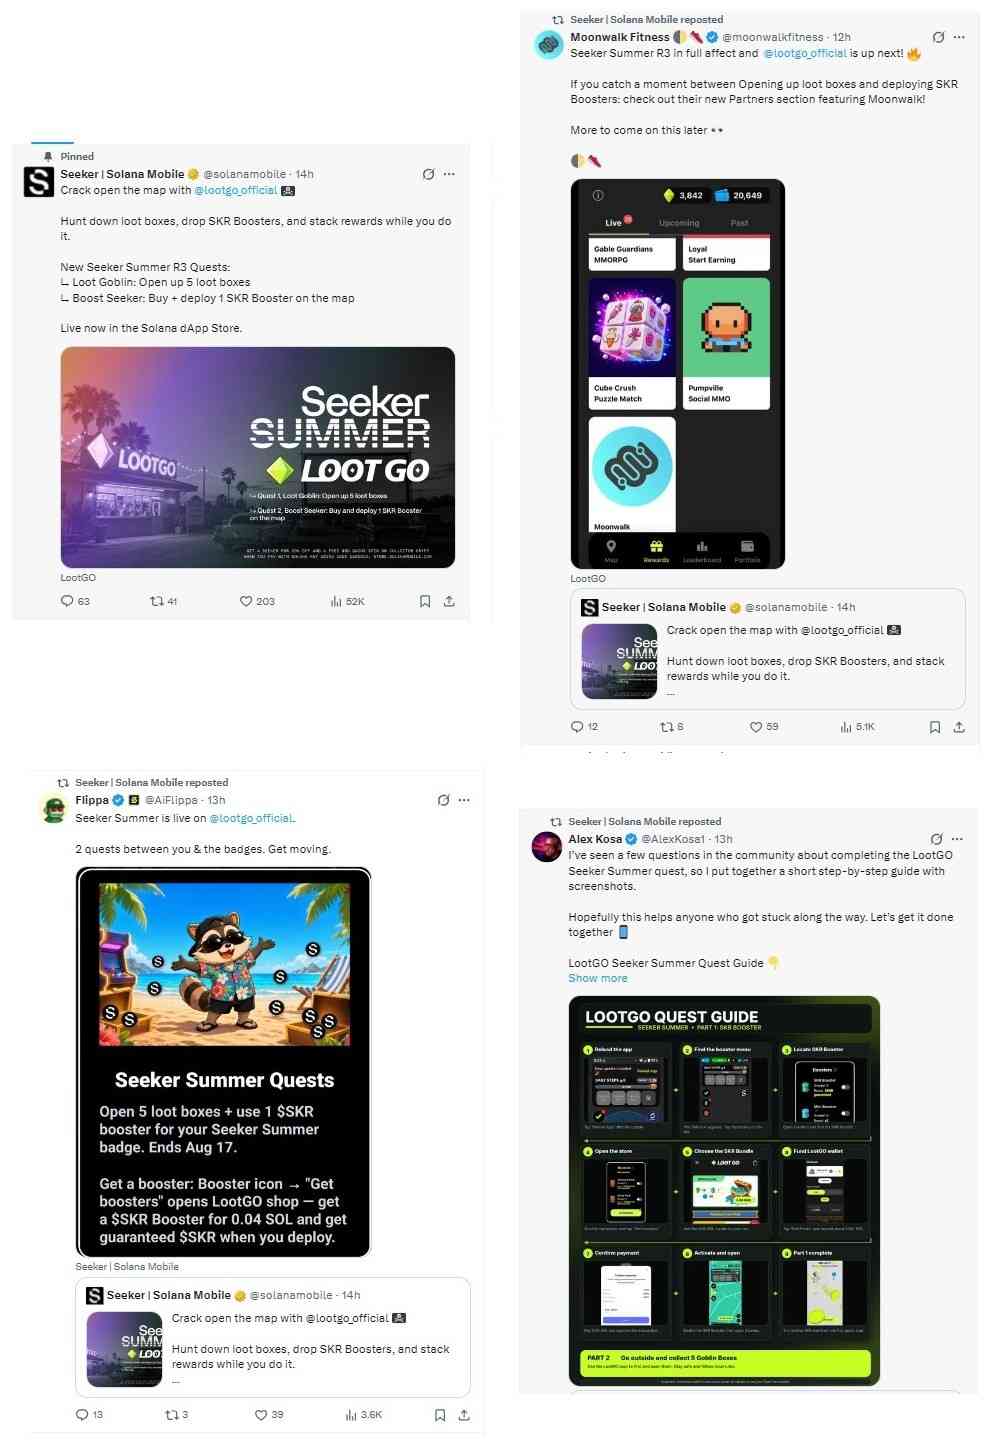
And volume like that rarely shows up without a reason. Solana Mobile's "Seeker Summer" campaign is currently live, pushing users throughloot box quests that require deploying $SKR boosters. Community guides on completing the quest have been circulating widely this week.
But there's a second piece to this. CoinGlass shows 24-hour liquidations of $193.40K, and short positions absorbed $168.36K of that. Shorts got squeezed. Basically, forced buybacks from liquidated shorts added fuel on top of organic quest demand.
Binance carries the largest share of SKR derivatives volume at $32.78M, with Bybit and Bitget trailing behind, and the fuller picture sits on theexchange listings page. That concentration matters. When one exchange dominates order flow, moves can happen fast in both directions.
SKR Technical Analysis Daily Chart
The daily SKR/USDT chart on MEXC, viewable on the$SKR trading chart, shows price closing near $0.00955 after opening at $0.00687, a 38.83% daily gain. The candle broke cleanly above a descending channel that had capped price since early July.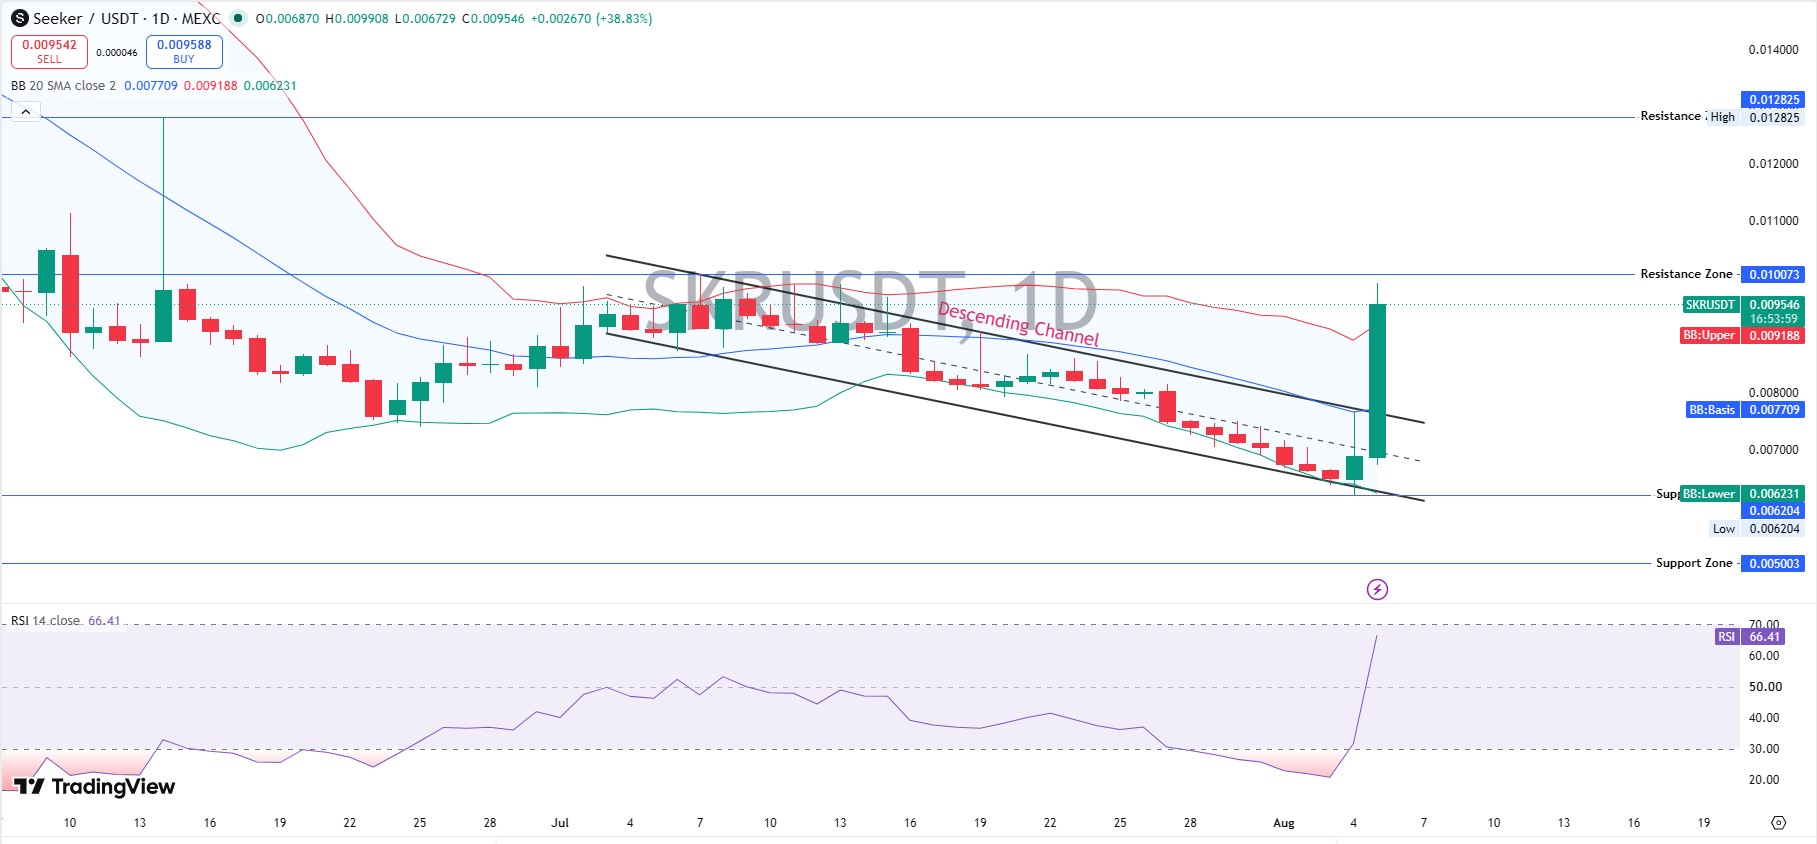
The Bollinger Band basis sits at $0.00771, with the upper band at $0.00919 already reclaimed. That's a meaningful signal. Price trading above its own upper band often means momentum is running hot, not exhausted.
RSI (14) reads 66.41 on the daily. That's elevated. It's not yet in classic overbought territory above 70, but it's close enough that a pullback toward the $0.00771 basis line wouldn't be surprising before any further upside.
The resistance zone sits at $0.01007, and the broader resistance high marks $0.01283. Immediate support lines up with the old channel top near $0.00620, backed by a deeper support zone at $0.00500.
SKR Technical Analysis Weekly Chart
Zoom out, and the picture gets more sobering. The weekly chart shows $SKR still inside a long descending channel dating back to February 2026, when price traded near $0.02 to $0.025 per candle.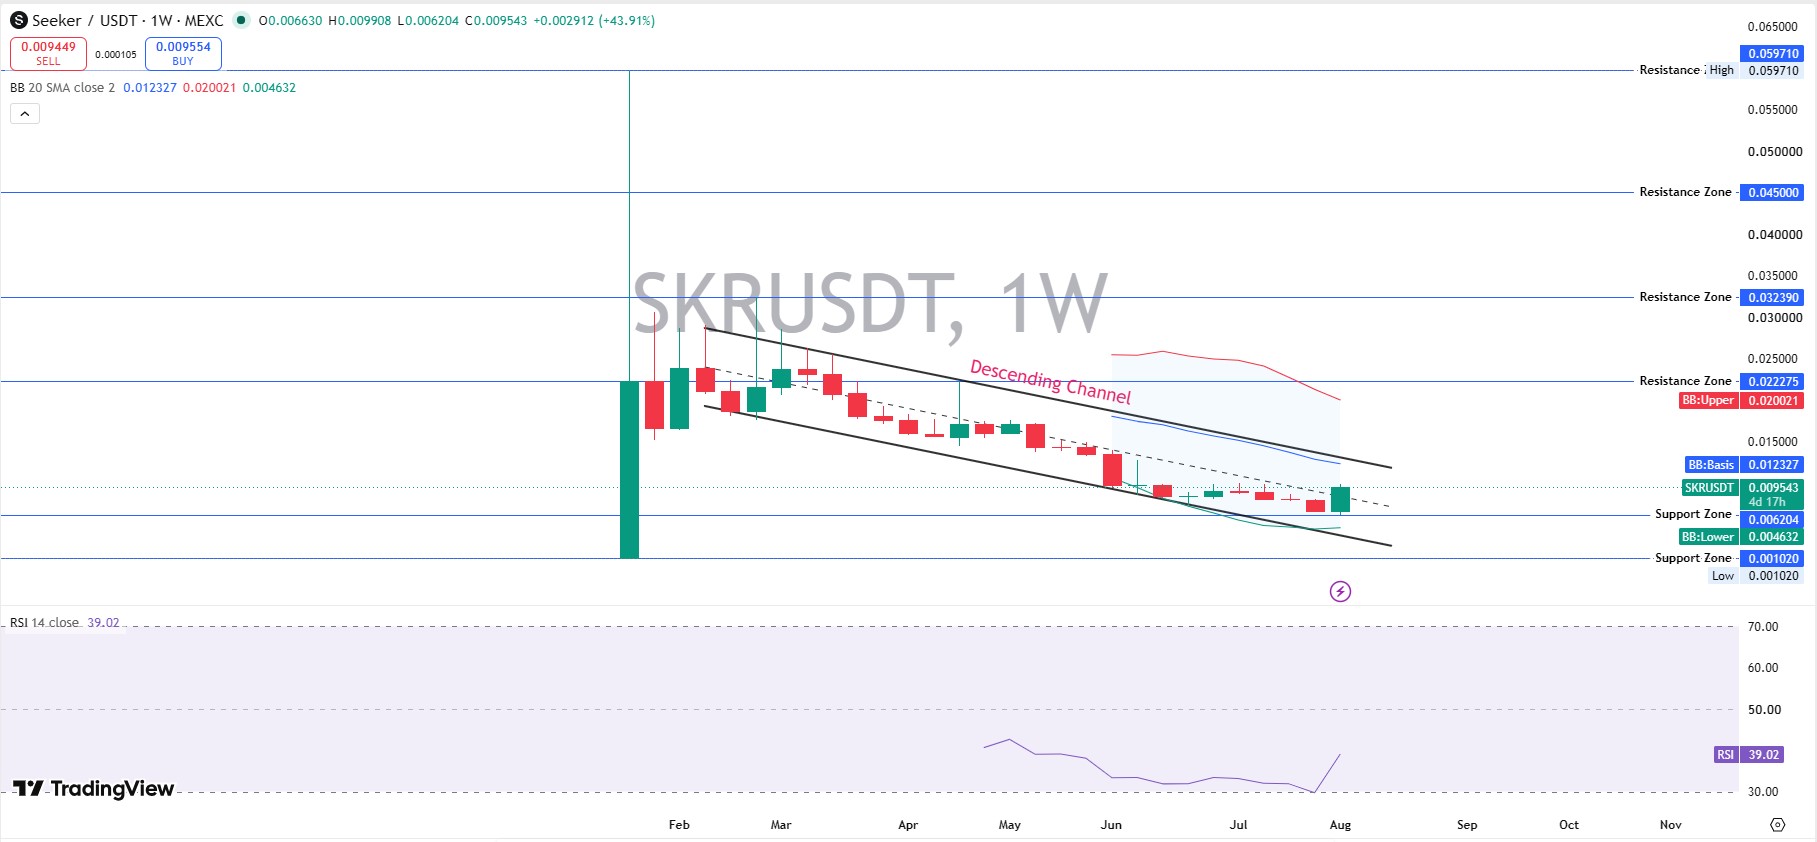
Weekly RSI reads just 39.02. That's still below the neutral 50 line. This tells us the multi-month downtrend hasn't technically reversed yet, even with this week's spike.
Weekly resistance zones stack up at $0.02228, $0.03239, and $0.04500, with the all-time high near $0.05971. Those levels are far above the current price and won't matter for weeks, maybe longer.
Weekly support sits at $0.00620, matching the daily chart's key level almost exactly. That confluence makes $0.00620 arguably the single most important price to watch, and it's worth tracking alongside thecoin events calendar for anything that could shake it loose.
Is Seeker (SKR) a High-Risk Altcoin?
SKR fits squarely into the small-cap altcoin category, not a meme coin, since it's tied to Solana Mobile's hardware and dApp ecosystem rather than pure speculation, a distinction worth keeping in mind if you also followmeme coin crypto news. Still, altcoin investing at this market cap carries real volatility risk.
With a market cap near $46.86M against a fully diluted valuation of $99.85M, roughly half the token's eventual supply isn't circulating yet. That's a common altcoin dynamic, and it's one every $SKR holder should understand before chasing green candles.
Liquidity-to-market-cap sits at just 2.78%, according to CoinMarketCap. Thin liquidity like that amplifies both pumps and dumps. It's not a reason to panic, but it is a reason to size positions carefully.
Seeker Tokenomics and Unlock Risk
Per theSolana Mobile whitepaper, SKR supply splits into six buckets: Airdrops (30%), Growth & Partnerships (25%), Solana Mobile Team (15%), Liquidity & Launch (10%), Community Treasury (10%), and Solana Labs (10%).
The team and Solana Labs allocations both carry a 12-month cliff followed by 36 months of linear unlocks. Growth & Partnerships unlocked 28% at launch, with the rest streaming out over 18 months.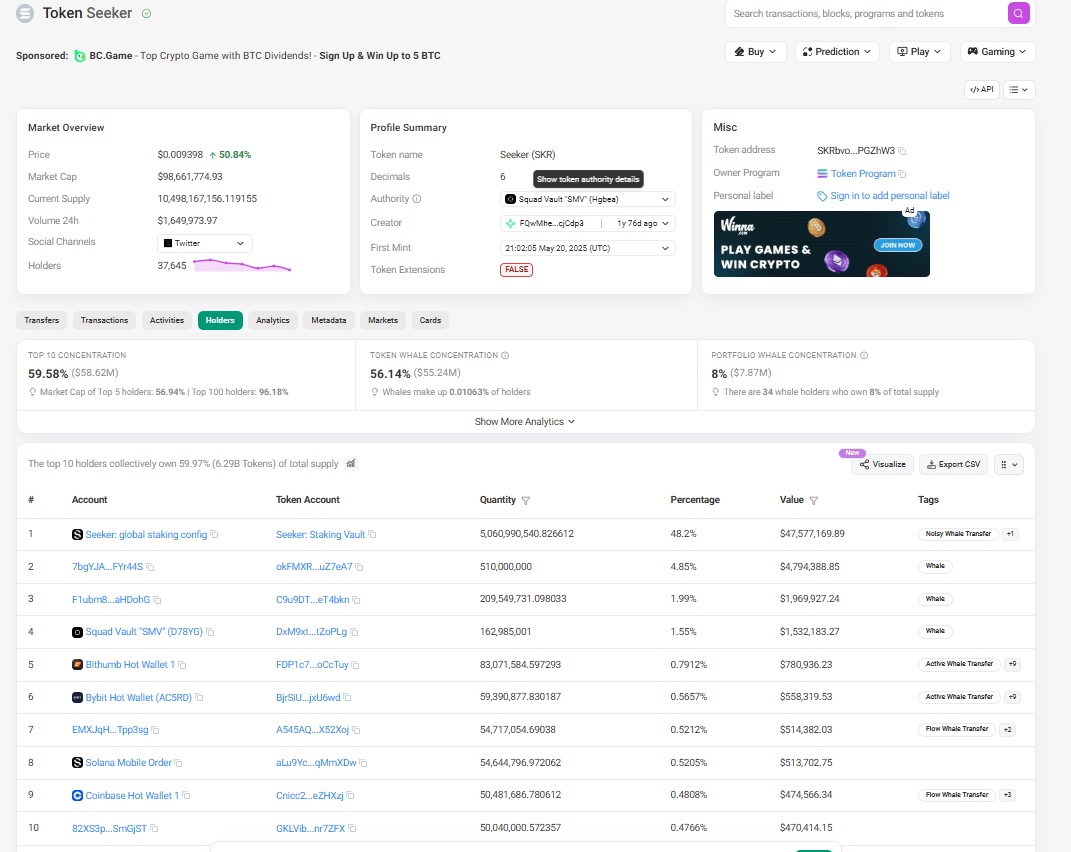
Circulating supply currently sits at 4.92 billion SKR against a total supply of 10.49 billion. That means more than half of all $SKR tokens are still locked or unreleased, a factor worth weighing alongside the crypto airdrops page for how similar unlock schedules have played out elsewhere.
Seeker Price Prediction: Bull, Base and Bear Cases
Scenario
Target Range
Timeframe
Probability
Key Condition
Invalidation
Bull Case
$0.0128 – $0.0160
30 days
Moderate
Clears $0.01007 resistance with volume
Daily close below $0.0075
Base Case
$0.0075 – $0.0100
30 days
Higher
Holds channel breakout, ranges sideways
Weekly close below $0.0062
Bear Case
$0.0050 – $0.0062
30 days
Lower
Loses $0.0062 support
The thesis is already broken
None of these are guarantees. This is scenario planning, not a promise.
24-Hour and 7-Day Outlook
Window
Bullish
Base
Bearish
24 Hours
Break above $0.0101
Hold $0.0080–$0.0095 range
Drop below $0.0075
7 Days
Push toward $0.0128
Consolidate near $0.0090
Retest $0.0062 support
Short-term, momentum favors continuation, but the daily RSI near 66 leaves room for a cooldown first. Don't rule out a chop before the next real move.
Seeker Price Prediction 2026
Looking at the rest of 2026, the weekly downtrend still needs to break before any long-term bullish case gets real conviction, a pattern that echoes recent moves covered in theBitcoin price prediction 2026 outlook. If SKR reclaims the $0.02228 weekly resistance zone, a broader recovery toward $0.032 becomes plausible.
But if quest-driven demand fades once Seeker Summer ends, this bounce risks fading with it. That's the honest read. Sustainable SKR price prediction 2026 targets depend far more on real dApp adoption than on booster campaigns, much like the demand question raised in theEthereum price prediction 2026 piece.
What Could Push SKR Lower
Macro conditions matter too. A hawkish surprise around any upcomingFed rate decision tends to hit small-cap altcoins hardest first.
Loss of the $0.0062 confluence support on daily and weekly charts.
Fading engagement once the current quest campaign concludes.
Token unlock pressure from the Solana mobile team and Solana Labs allocations.
A broader Solana ecosystem pullback dragging correlated tokens down.
Continued thin liquidity relative to market cap.
Glossary
RSI (Relative Strength Index):A momentum indicator from 0 to 100; above 70 often signals overbought, below 30 oversold.
FDV (Fully Diluted Valuation):What the market cap would be if all tokens were circulating.
Liquidity Ratio:Available trading liquidity divided by market cap; low ratios mean thinner, more volatile markets.
Descending Channel: A chart pattern of lower highs and lower lows contained between two parallel trendlines.
Regulatory headlines can move altcoins fast too, and theClarity Act senate update is a good one to watch this month.
Holder and supply data updates in real time viaSeeker on Solscan, which is worth bookmarking alongside this piece.
For a wider view of daily market moves, thelatest crypto news page rounds up what's shifting sentiment across the board today.
Disclaimer: This article is for informational purposes only and isn't financial advice. Crypto markets are volatile; do your own research before making any investment decision. Data captured August 5, 2026, 07:00 UTC, from CoinMarketCap, CoinGlass, and project-published sources.