Shiba Inu Price Prediction: What's Going On Shiba Inu price prediction searches always spike when the coin goes this quiet, and right now SHIB is about as quiet as it gets. Price has been gri
Shiba Inu Price Prediction: What's Going On
Shiba Inu price prediction searches always spike when the coin goes this quiet, and right now SHIB is about as quiet as it gets.
Price has been grinding sideways for a while, tightening up little by little, the kind of setup where nothing seems to be happening until it does.
Burn activity just jumped hard behind the scenes, some big wallets have been moving, and the charts are pointing at a decision point that's close.
Is SHIB about to bounce back up, or is there one more leg down first? That depends on which line breaks. Here's what the charts, the liquidations, and the burn numbers are actually showing.
Current Market Snapshot
MetricValuePrice$0.00000415 (-0.04% 24h)Market Cap$2.44B (-0.04%)Unlocked Mkt Cap$2.44B24h Volume$45.79M (+17.54%)Vol/Mkt Cap1.85%FDV$2.44BLiq/Mkt Cap0.15%Total Supply589.49T SHIBMax Supply589.55T SHIBCirculating Supply589.24T SHIBHolders3.06M
Source:Data from CoinMarketCap as of 20/07/2026. Figures may vary slightly across other tracking websites.
Price barely moved today, but trading volume jumped almost 18%. When volume rises and price stays flat, something is usually happening quietly under the surface.
$SHIB Liquidation Data: Long Traders Keep Getting Hit
According tothe Coinglassliquidation data over the last day, one thing stands out fast:
Shorts have barely been touched. Longs have taken almost every single liquidation across all four windows. 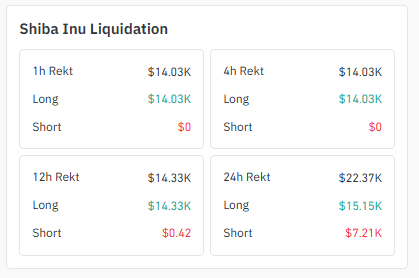
Source:Liquidation Data Taken From Coinglass.
TimeframeTotal RektLongsShorts1h$14.03K$14.03K$04h$14.03K$14.03K$012h$14.33K$14.33K$0.4224h$22.37K$15.15K$7.21K
That fits the descending triangle pattern well; people keep trying to call the bottom too early and get shaken out before support actually holds.
Shiba Inu Exchange Volume Heatmap
As per Coinglass Exchange volume for $SHIB is spread across several exchanges, but one platform is clearly out in front: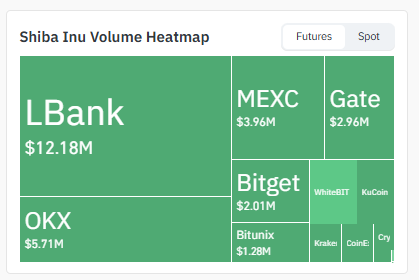
Source: Volume Heatmap Data Taken From Coinglass.
Exchange24h Futures VolumeLBank$12.18MOKX$5.71MMEXC$3.96MGate$2.96MBitget$2.01MBitunix$1.28M
Smaller amounts are also showing up on WhiteBIT, KuCoin, Kraken, CoinEx, and Crypto.com. LBank alone is holding close to a quarter of total tracked volume, a pretty concentrated spot for such a widely traded coin.
4-Hour Chart: Sitting on Triangle Support
The 4H chart shows a clean descending triangle. There's a flat line of support at the bottom and a resistance line above it sloping down into a smaller and smaller box. Right now, the price is sitting almost exactly on that support line, near $0.00000415.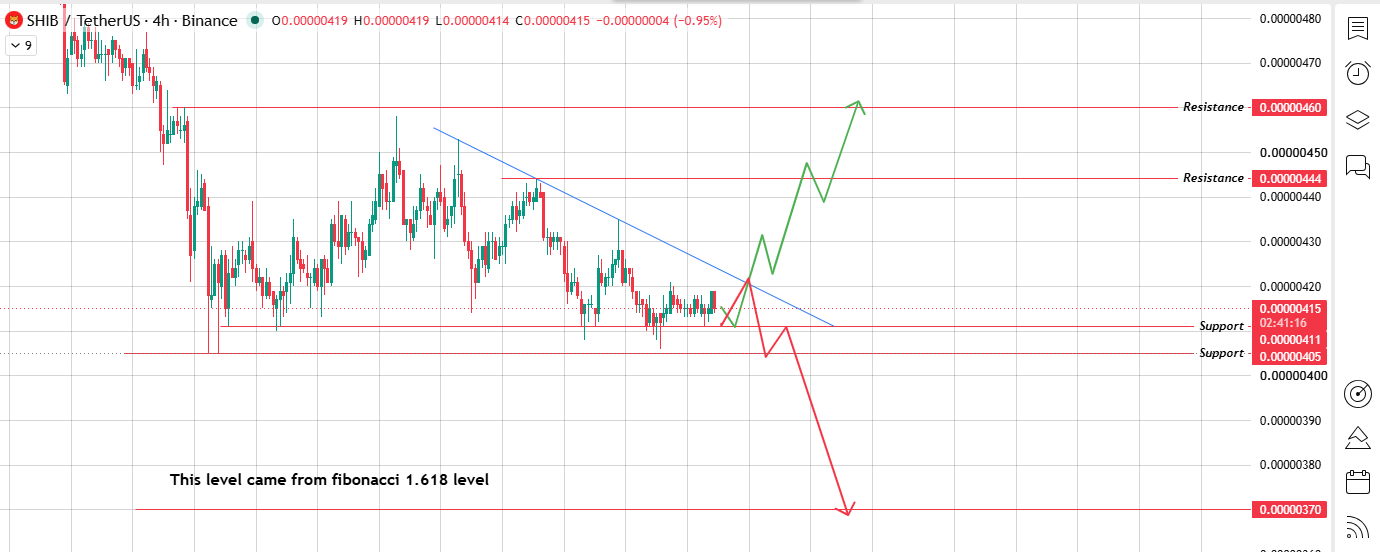
Source:Chart Taken From TradingView
Resistance level: $0.00000444
Resistance level: $0.00000460
Support zone: $0.00000411
Support zone:$0.00000405
Fibonacci1.618 downside target: $0.00000370
If the price pushes up and breaks through the top line of the triangle, that's the bullish breakout; it should climb toward $0.00000444 first, then $0.00000460.
But if that breakout doesn't hold and the price falls back down, that's a bearish breakdown, and it could drop to $0.00000405. If selling keeps going after that, the next stop is the fib target at $0.00000370.
1-Day Chart: Boxed In Under a Falling Trendline
Zoom out to the daily chart, and SHIB has been stuck insideways consolidation for a while now.
There's a falling trendline coming down from the pattern's high point, pressing down on price from above, keeping it boxed in.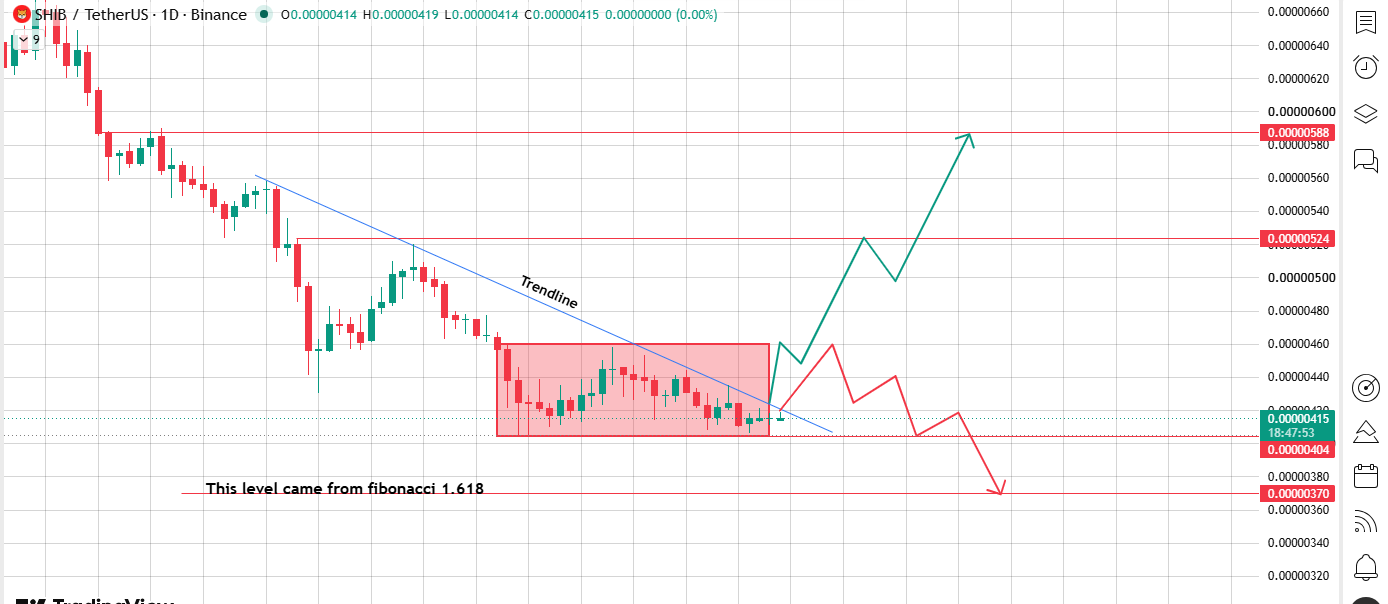
Source:Chart Taken From TradingView
If SHIB breaks above that falling trendline with a strong daily close, the next levels to watch are $0.00000524 and then $0.00000588 if momentum keeps going.
If the breakout fails instead, the price could fall to $0.00000404 first and then all the way down to $0.00000370, the same fib level the 4H chart is also pointing at.
Both timeframes lining up on the same downside number makes it a level worth keeping an eye on.
Three-Scenario OutlookScenarioShort-Term (4H) TargetLong-Term (1D) TargetBullish$0.00000444 → $0.00000460$0.00000524 → $0.00000588Neutral / RangeSitting near $0.00000415 supportConsolidate between $0.00000404 and $0.00000419Bearish$0.00000405 → $0.00000370$0.00000404 → $0.00000370
Social Sentiment: Burn Spike and Whale Activity
Burn tracker Shibburn posted something worth noting this week: 13,993,026 SHIB burned in just 24 hours, worth about $57.62 at current prices.
The daily burn rate itself jumped 312.94%, a big spike even by SHIB's usual standards.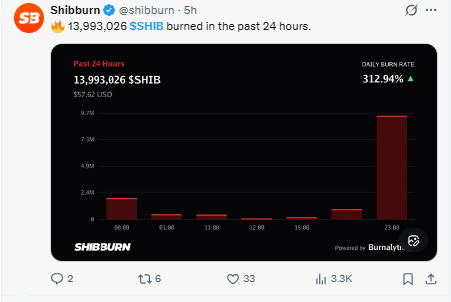
Here's the part that matters, though: almost 14 million tokens sounds impressive until you compare it to a total supply of 589.24 trillion.
That one day of burning is roughly 0.0000024% of the entire supply, basically nothing in the bigger picture.
Shiba inu whale activity around these burn spikes tends to get a lot of attention on social media, and it's fair to keep an eye out for large wallets accumulating, but the burn itself isn't shrinking supply in any way that moves price right now.
Will a Shiba Inu Reach $1? Let's Do the Math
This question comes up all the time, so let's actually work it out instead of guessing. SHIB's circulating supply is 589.24 trillion tokens.
If each one were worth $1, the total value of all SHIB would be about $589 quadrillion.
For comparison, the entire world's yearly economic output is around $105 trillion, and the total global wealth of every asset on Earth combined is estimated near $454 trillion.
SHIB at $1 would be worth more than everything on the planet put together, several times over. It's not just unlikely; it's mathematically off the table at the current supply.
Even a smaller price target like one cent ($0.01) would need SHIB's total value to hit about $5.89 trillion, bigger than any company or asset has ever been worth.
For SHIB to have any real shot at higher prices, the supply would need to shrink by a huge amount through burning, way faster than what we're currently seeing.
At today's burn pace, cutting a 589-trillion-token supply down to something meaningful would take an extremely long time.
A more realistic way to think about Shiba Inu's $1 potential is as a distant, supply-shock-dependent idea, not something today's charts are pointing toward.
Technical vs. Sentiment Targets ComparedSourceTime FrameTarget Range4H Chart (Descending Triangle)Short-term$0.00000370 – $0.000004601D Chart (Sideways Consolidation)Medium-term$0.00000370 – $0.00000588Burn/Whale SentimentSpeculative / Long-termDepends on supply shrinking; no fixed number yet
The technical range here is tight and comes straight from the charts. Burn-driven hope is a real story worth following, but it plays out on a totally different timeline than what the current chart patterns are showing.
BTC Dominance and ETH Correlation Context
SHIB doesn't move completely on its own. BTC dominance shifts often decide how much money is even available to flow into meme coins like SHIB in the first place.
$SHIB-ETH correlation means a broader mood across the bigger coins usually shows up in SHIB's price before any SHIB-specific news does.
Both are worth checking alongside any shiba inu price prediction, especially during a quiet stretch like this one.
Final Outlook
SHIB sitting right on triangle support, with a daily consolidation box squeezing tighter overhead, is a clear "wait and see" setup.
The heavier long liquidations over the past day show the market hasn't picked a side yet. A real move needs a strong close above $0.00000444 short-term, or $0.00000524 longer-term, to shift things bullish.
Until that happens, $0.00000405 down to $0.00000370 is the zone to watch if support breaks instead.
The burn spike and whale chatter are worth following for general shiba inu crypto sentiment, but they don't replace what the charts are actually saying right now.
Glossary
A descending triangle flat support at the bottom and a resistance line sloping down from above, squeezing the price tighter over time. Usually leans bearish if it breaks the wrong way.
Sideways consolidation price is stuck moving back and forth in a tight range, usually while the market waits for something to push it out one way or the other.
A resistance level and a support zone are really just two sides of the same idea: one's the ceiling sellers keep defending, and the other's the floor buyers keep showing up to defend.
The liquidation heatmap shows where leveraged trades are getting force-closed across exchanges and which side is taking the pain. Exchange volume is simpler; it's just the total amount of trading happening for a coin, added up across all the exchanges it trades on.
Two more terms worth knowing: BTC dominance is Bitcoin's slice of the whole crypto market, and ETH correlation is how closely a coin's price tends to move alongside Ethereum's.
Methodology
Every chart level in this shiba inu price prediction comes straight from the uploaded 4H and 1D TradingView charts, including the Fibonacci 1.618 target marked on both.
Nothing is guessed or added on top. Liquidation and exchange volume numbers come from live derivatives dashboards, and burn data comes from Shibburn's public tracker.
The $1 market cap math uses SHIB's current circulating supply compared against standard global wealth and GDP figures.
Reflects market conditions as of July 20, 2026. Informational only, not financial advice.
Disclaimer: This article is for informational and educational purposes only and should not be considered financial advice. Cryptocurrency investments carry risks, and prices can be highly volatile. Always conduct your own research and consult a qualified financial advisor before making any investment decisions.