Shiba Inu Coin launched in August 2020 as an Ethereum-based token positioning itself as an alternative to Dogecoin. It grew into one of the largest meme coin communities by holder count over
Shiba Inu Coin launched in August 2020 as an Ethereum-based token positioning itself as an alternative to Dogecoin.
It grew into one of the largest meme coin communities by holder count over the following years.
Later, it expanded into its own Shibarium network and a wider token ecosystem.
Anyone searching for a Shiba Inu price prediction today will find $SHIB trading around $0.00000515, up roughly 0.4% over the last 24 hours.
Its market capitalization sits close to $3.039 billion on a circulating supply above 589 trillion tokens.
Live Market Data
Metric
Value
Price
$0.00000515
24h Change
+0.4%
Market Cap
$3.039B
Fully Diluted Valuation
$3.04B
24h Trading Volume
$76.275M
Circulating Supply
589.239T SHIB
Total Supply
589.496T SHIB
24h Range
$0.00000507 - $0.00000521
Source: $SHIB market cap data taken from CoinGecko, data as of Sep 02, 2026. Figures may vary slightly across other tracking websites.
Exchange Volume
Exchange
24h Volume
LBank
$16.40M
OKX
$13.69M
MEXC
$5.38M
Bitget
$5.07M
Bitunix
$2.70M
Gate
$2.59M
KuCoin
$1.47M
WhiteBIT
$1.44M
Source: Volume Heatmap Data Taken From CoinGlass, As of Sep 2, 2026
Futures volume is concentrated on LBank and OKX, together accounting for a large share of tracked activity. That concentration suggests leveraged traders are actively positioning around the wedge breakout attempt.
Liquidation Snapshot
Window
Total
Long
Short
4h
$22.30K
$10.18K
$12.12K
12h
$46.83K
$34.22K
$12.61K
24h
$77.84K
$55.87K
$21.97K
Source: Liquidation Data Taken From CoinGlass, As of Sep 2, 2026
long liquidations over the past day, a pattern consistent with a squeeze during the wedge breakout push.
The 12-hour window flips the other way, with more longs wiped out, showing two-sided volatility rather than one clean directional flush.
That back and forth fits a market still deciding whether the wedge breakout deserves to hold, rather than one already committed to a single direction.
Shiba Inu Coin News
Social sentiment around $SHIB leans bullish this week. A post from Web3 News pointed to the size and staying power of the Shiba Inu community as a reason for continued optimism. 
Source: Data Taken From @Web3news_Org, X Account, As of Sep 02, 2026
That reflects holder sentiment, though, rather than a verified market signal.
Separately, U. Today published a piece asking whether $SHIB is forming a bull flag capable of pushing the price into a new decimal range. 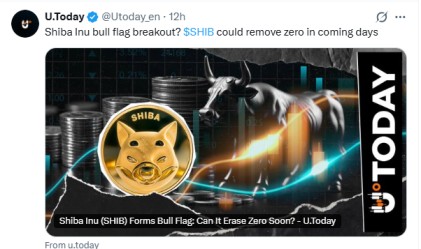
Source: Data Taken From @Utoday_en, X Account, As of Sep 02, 2026
That framing is speculative and comes from a secondary media source. It should be treated as commentary, not a confirmed development.
Key Takeaways
$SHIB trades near $0.00000515, up about 0.4% in the past day, after pushing through a falling wedge trendline on the daily chart, though the breakout candle is still running and unconfirmed.
Price is holding just above the 21 EMA at $0.00000506, with resistance layered at $0.00000575, $0.00000670, and $0.00000725.
A failed breakout could send the price back toward support at $0.00000488, $0.00000475, and $0.00000440.
24-hour liquidations lean short side ($55.87K vs $21.97K long), hinting at some short covering during the recent push.
Market cap sits near $3.039 billion on a circulating supply of 589.239 trillion SHIB.
Technical Analysis of Shiba Inu Coin
The daily SHIB/USDT chart on Binance shows the price spending an extended stretch inside a descending channel. It then broke above the channel's upper boundary in a sharp rally.
That move faded into a second descending channel, which also broke to the upside before running into resistance and pulling back.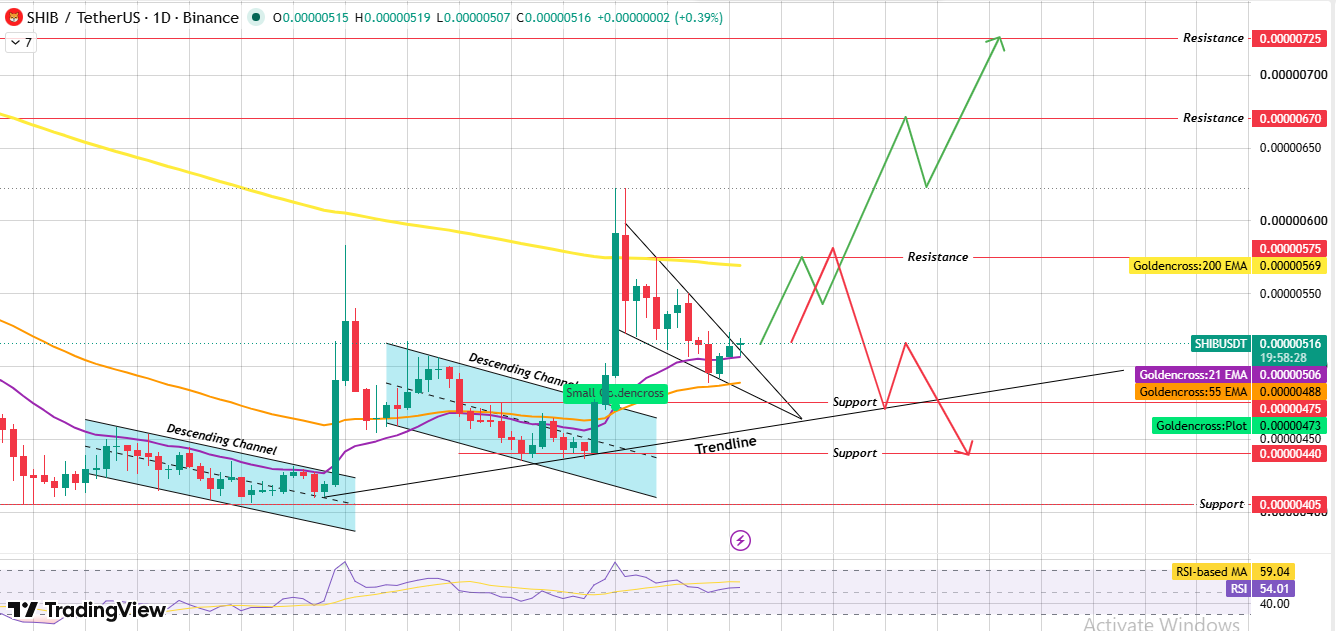
Source: Chart Taken From TradingView, As of Sep 2, 2026
The pullback carved out a falling wedge, and the current, still-open daily candle has pushed through that wedge's falling trendline.
Since the candle has not closed yet, this Shiba Inu price prediction treats the breakout as tentative rather than confirmed.
Price Sits Right at the 21 EMA
$SHIB near $0.00000516 is trading just above the 21 EMA at $0.00000506, while the 55 EMA sits slightly lower at $0.00000488. The 200 EMA remains overhead at $0.00000569, making it the next real test for bulls.
Holding above the 21 EMA keeps the short-term structure tilted upward; slipping beneath it would put the 55 EMA and trendline support back in focus.
The gap between the 21 EMA and the 200 EMA also matters here. That gap shows the chart is still in a longer-term downtrend, even as short-term momentum tries to turn higher.
A move past the 200 EMA would carry more weight than simply clearing local resistance.
Confirmation Rule and What Rejection Looks Like
For this breakout to be considered valid, the daily candle needs to close above the wedge trendline near $0.00000520.
That close also needs volume exceeding the recent 20-day average. Without both conditions, the setup stays unconfirmed.
If resistance near $0.00000575 rejects price instead, support steps down toward $0.00000488, then the trendline at $0.00000475, with $0.00000440 as the next cushion below.
EMA Levels
EMA
Value
Price Position
21 EMA
$0.00000506
Price trading above
55 EMA
$0.00000488
Price trading above
200 EMA
$0.00000569
Price trading below
Golden Cross
$0.00000473
Price trading above
Support and Resistance Levels
Level
Price
Resistance 3
$0.00000725
Resistance 2
$0.00000670
Resistance 1
$0.00000575
Support 1 (Trendline)
$0.00000475
Support 2
$0.00000440
Support 3
$0.00000405
Bull, Base, and Bear Case
Scenario
Price Range
Key Trigger
Bull Case
$0.00000575 – $0.00000725
The daily candle closes above the wedge trendline with volume above the 21-day average.
Base Case
$0.00000488 – $0.00000575
Price chops between the 21 EMA and 200 EMA without a decisive close either way
Bear Case
$0.00000440 – $0.00000475
Resistance near $0.00000575 rejects the price, and the wedge breakout fails to hold.
Expert Opinion
Coverage from U.Today has framed the recent structure as a possible bull flag breakout. That said, this remains a media interpretation of the chart rather than a verified technical confirmation.
Traders following this SHIB technical outlook will likely weigh a confirmed daily close above the wedge trendline more heavily than headline speculation.
Rising volume on that close matters just as much as the level itself.
Glossary
Falling wedge: Picture two downward-sloping lines squeezing the price into a narrower and narrower range. A break above the upper line is often read as an early bullish cue, but it still needs volume behind it to mean much.
EMA:Exponential Moving Average, because it weights recent candles more heavily than old ones. That extra weighting is exactly why it reacts faster to short-term shifts than a plain moving average.
A goldencross shows up here whenever a shorter EMA crosses above a longer one. Momentum traders tend to read that crossover as an early shift in trend bias, nothing more definitive than that.
Liquidations are what happen when an exchange force closes a leveraged position, usually because the trader can no longer cover the potential loss. Heavy liquidation totals stacking on one side often line up with sharp, fast moves in price.
Finally, a descending channel is just a downtrend boxed in by two parallel lines. This chart is a good reminder that breaking out of one doesn't guarantee the next leg holds. $SHIB's second channel formed right after the first breakout ran out of steam.
Methodology
This Shiba Inu price prediction starts with a daily SHIB/USDT chart on Binance, viewed through TradingView. It's paired with live data on price, market cap, supply, exchange volume, and liquidations.
Every level cited here comes straight from that chart. Nothing is pulled from an outside calculator or rounded estimate.
Two social posts get a mention in the Market Pulse section above. Both are flagged as commentary, not fact, which is how this Shiba inu price forecast handles unverified claims throughout.
One more note worth flagging: the breakout candle was still open at the time of writing. Rather than assume the move already happened, this analysis leans on a clear confirmation rule built around closing price and volume.
Disclaimer: This article is for informational purposes only and does not constitute financial or investment advice. The bull, base, and bear scenarios above are derived from technical chart patterns and carry meaningful uncertainty. Meme tokens such as Shiba Inu can move by double-digit percentages within a single session, and any of these outcomes could fail to materialize. Past performance and chart patterns do not guarantee future results. Only invest funds you can afford to lose, and consult a licensed financial advisor before making investment decisions.
