Silver price broke above $30. Then it ran to $120. Now it’s near $75. Most people call it a speculative bubble. They’re wrong. The real story sits underground. Mine output stopped growing aro
Silver price broke above $30. Then it ran to $120. Now it’s near $75.
Most people call it a speculative bubble. They’re wrong.
The real story sits underground. Mine output stopped growing around 2015. Global production stays flat near 850 million ounces per year. Meanwhile, solar panels, AI data centers, and electronics keep eating more silver.
You can’t open a new mine overnight. Discoveries are rarer. Permits take longer. Ore grades keep falling. That’s why silver prices climb.
Silver Price Rallies Because New Mines Take Forever
Otavio Costa put it plainly: structural demand collides with stagnant production.
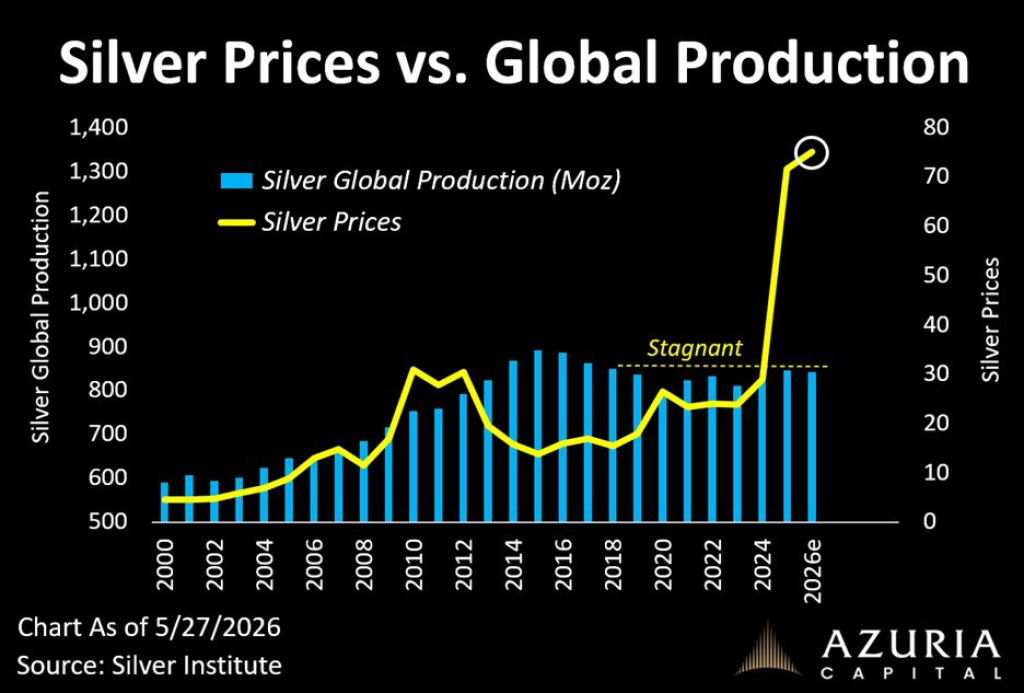
Look at the first chart. Global silver production grew from 580 million ounces in 2000 to roughly 850–900 million by 2015. Then it flatlined. No meaningful growth for ten years.
Silver prices stayed mostly between $15 and $35 during that flat supply period. But the chart projects a move toward $75–80 by 2026.
 Source: X/@TaviCosta
Here’s the bullish argument that works:
- Solar manufacturing eats silver by the ton.
- AI infrastructure and electrification need silver in every circuit.
- Most silver comes as a byproduct of copper, lead, and zinc. Those miners don’t ramp up just for silver.
- Multiple years of reported market deficits drained inventories.
If demand rises and supply stays near 850 million ounces, prices must adjust higher.
But let me be clear about what I don’t buy. The chart jumps from $30 to $75 without a real model. It says production flat = moon. Reality is harder.
Prices also depend on ETF flows, interest rates, dollar strength, gold’s moves, and recession risk. Stagnant supply supports higher prices. It does not guarantee $75 silver.
Read also: Here’s Why Silver and Gold Prices Are Crashing Right Now
Silver Chart Analysis (4-Hour Chart)
The second chart shows what actually happened.
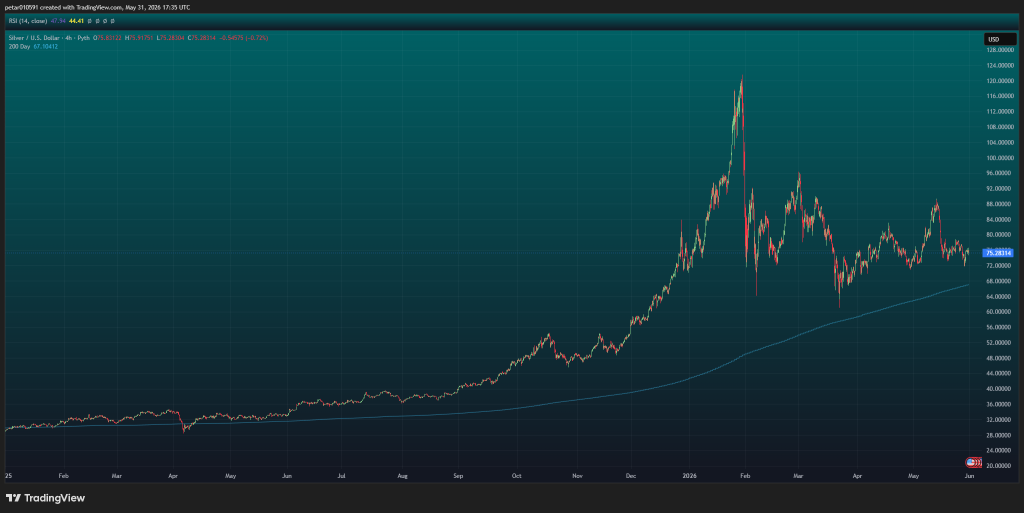
First, a massive blow-off rally. Silver ran from the $30s in late 2025 to over $120 at the peak. That move was parabolic.
Then a violent correction. Price collapsed from $120 to roughly $65. That flush cleaned out many leveraged longs. Classic post-speculative peak behavior.
Now the silver price trades near $75. The market has spent months moving sideways between $70 support and $90 resistance. That’s digestion. No panic.
 Source: TradingView
One strong sign: price stays above the 200-day moving average at $67. Current levels are making higher lows relative to the post-crash bottom. Technically, that’s constructive.
Break above $88–90 and $100 becomes realistic. Momentum traders would pile back in. The larger uptrend would resume.
Lose $70 support, then the 200-day near $67. A deeper drop toward the low $60s becomes possible.
Most likely near term? More trading between $70 and $90. The market waits for the Fed, inflation data, or gold to make the next move.
Silver Price Predictions for This Week (June 1 – June 7)
Monday–Tuesday (June 1–2): Range $74–78. Low volume start. No major data.
Wednesday (June 3): Watch for any ISM manufacturing print. Strong dollar keeps the silver price in check. Expected $73–77.
Thursday (June 4): Jobless claims routine. Silver follows gold. Likely $74–78.
Friday (June 5): Non-farm payrolls. A hot number pushes silver toward $70 support. A weak number sends it to test $80. Most probable close near $76.
Weekend (June 6–7): Thin liquidity. Price drifts between $75 and $77.
Final take: Production won’t surge this year or next. Wake me up when miners actually ramp up. Until then, silver holds $70–90. A break one way or the other needs fresh fuel.
Subscribe to our YouTube channel for daily crypto updates, market insights, and expert analysis.
The post Silver Price vs. Global Production – Why Miners Can’t Keep Up appeared first on CaptainAltcoin.