Siren price prediction is back in focus after SIREN broke out of its rising wedge and settled into a tight accumulation zone, one that already saw a liquidity sweep on its lower edge before t
Siren price prediction is back in focus after SIREN broke out of its rising wedge and settled into a tight accumulation zone, one that already saw a liquidity sweep on its lower edge before the price pulled back inside the range.
Quick Take: $SIREN is trading near $0.03107. This is a short-term read based on the 1-hour chart and should be rechecked if the price closes decisively beyond either $0.03213 or $0.03017.
$Siren Price Right Now
Metric
Value
Price
$0.03107
24h Change
+0.32% (+$0.00009853)
Market Cap
$25.33M
Futures Volume (24h)
$11.56M
Spot Volume (24h)
$300.74K
Open Interest
$25.55M
Circulating Supply
724.05M SIREN
Total Supply
724.05M SIREN
Max Supply
Not disclosed
The price on the tracked chart sits at $0.03107, with volume, market cap, open interest, and supply figures from Siren data on CoinGlass, as of July 26, 2026, around 4:49 PM IST.
Methodology And Data Sources
This Siren price prediction uses the 1-hour SIREN/USDT perpetual chart on Binance via TradingView for price structure, with volume, open interest, and market cap figures from CoinGlass and liquidation flow from CoinGlass's SIREN liquidation tracker.
All levels are treated as invalidated only on a confirmed candle close beyond the stated trigger, not an intraday wick.
This is a short-term, intraday read and is not intended as a long-term Siren price forecast.
Where $SIREN Volume Is Concentrated
Trading activity in $SIREN futures is heavily concentrated on a handful of exchanges.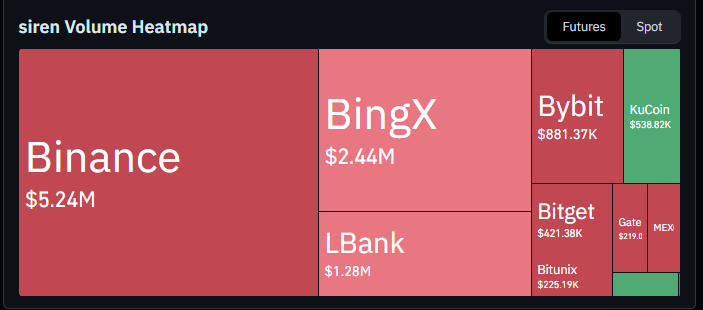
Binance leads with $5.24M in 24-hour volume, followed by BingX at $2.44M and LBank at $1.28M. Bybit adds $881.37K, Bitget contributes $421.38K, and KuCoin rounds out the larger venues with $538.82K, while smaller amounts trade across Gate and a few other platforms.
This concentration on a small set of exchanges means liquidity can thin out quickly outside the top venues, something worth keeping in mind around the current range.
$Siren Liquidation Data Today
Liquidation activity over the past day has leaned almost entirely toward longs getting caught out.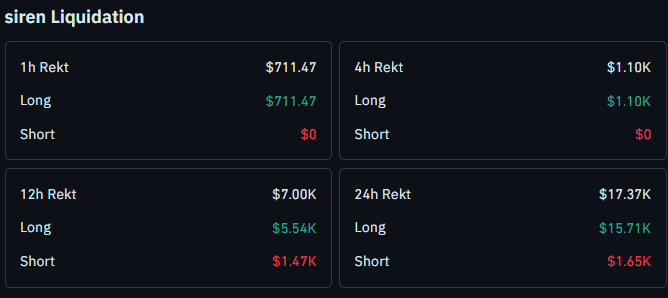
Over the past hour, $711.47 was liquidated, and all of it came from long positions, with zero short liquidations in that window.
The 4-hour figure shows $1.10K in total liquidations, again made up entirely of longs, with no short liquidations recorded.
Over 12 hours, the total climbs to $7.00K, with $5.54K from longs and $1.47K from shorts.
Across the full 24 hours, liquidations reach $17.37K, and longs account for $15.71K of that figure, while shorts make up the remaining $1.65K.
The consistent long-side skew across every window lines up with the pullback from the wedge breakout high, suggesting buyers who chased the move have been the ones absorbing most of the pain so far.
A full breakdown is available through theSIREN hidden breakout setup coverage on CoinGlass liquidation data.
Siren Price Prediction: 1-Hour Chart Analysis
The following levels are based solely on the 1-hour Binance perpetual chart.
$SIREN had been climbing steadily inside a rising wedge, a structure covered in detail in ourSIREN ascending triangle breakout piece.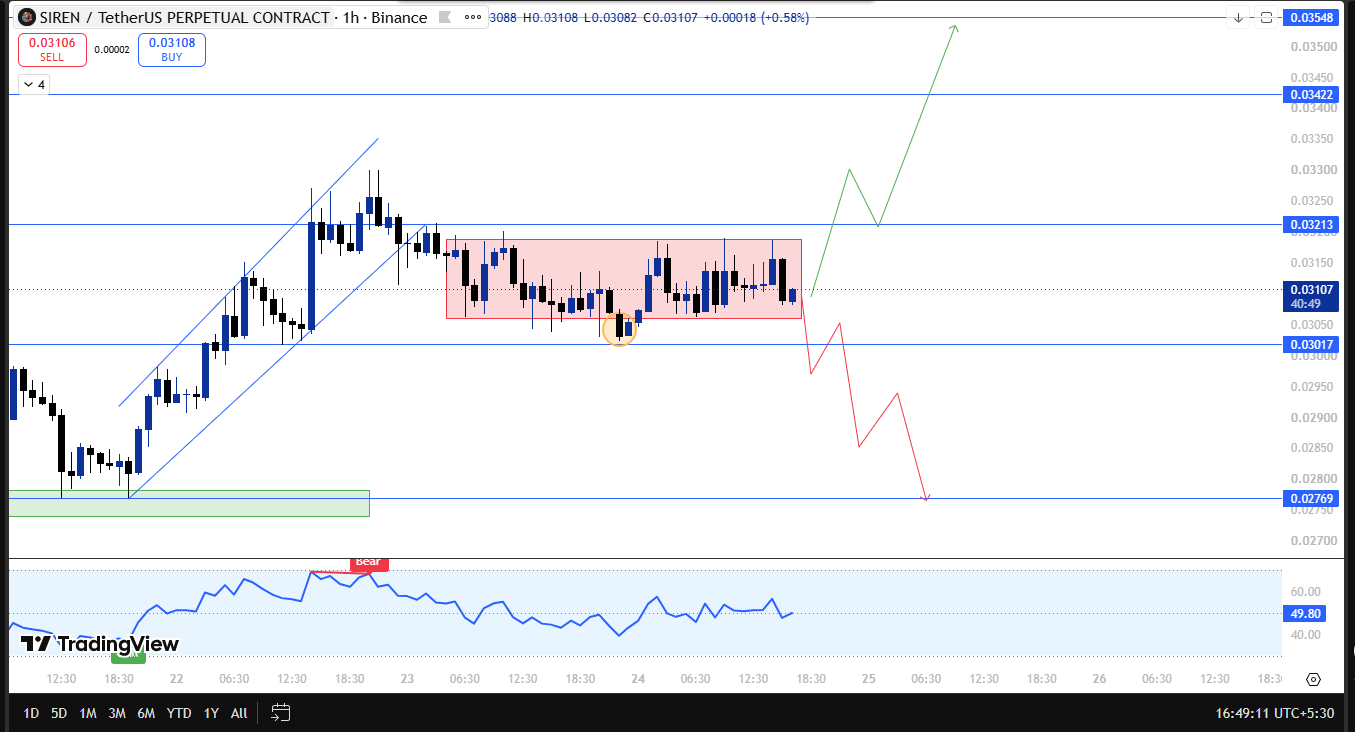
Once that wedge broke, instead of continuing cleanly higher, price shifted into a sideways accumulation zone, trading back and forth in a defined range.
Within that range, price dipped below the lower edge in what looks like a liquidity grab, sweeping stops sitting below the zone before snapping back inside it.
That kind of move often clears out weak positioning before the next real decision point, and $SIREN has been trading back inside the range since.
If $SIREN breaks above 0.03213 and this accumulation range, the next resistance levels come into view at $0.03422, with $0.03548 as the extended target beyond that.
If price instead breaks down and closes below $0.03017, that would mark a failure of the range, opening the door to $0.02769 as the next support zone in view.
Siren Technical Snapshot
Indicator
Signal
Trend
A rising wedge broken; the price is now consolidating in a defined range
Structure
Liquidity grab below the range already swept, price back inside
Liquidations
Longs dominate every window over the past 24 hours
Volume
Concentrated mainly on Binance, BingX, and LBank
For a look at how a similar consolidation phase played out for SIREN before, ourSIREN turning point coverage walks through a comparable stage of the setup.
Siren Support And Resistance Levels To Watch
Type
Level
Note
Resistance 2
$0.03548
Extended upside target
Resistance 1
$0.03422
First target on a confirmed break above the range
Current Price
$0.03107
Trading inside the accumulation range
Support 1
$0.03017
Lower edge of the range, key closing-basis level
Support 2
$0.02769
Next level on a confirmed close below $0.03017
Risk-Reward Table
Case
Trigger
Target
Bull Case
Breaks above the accumulation range and price of 0.03213
Move toward $0.03422 and then $0.03548
Bear Case
Breaks and closes below $0.03017
Slide toward $0.02769
Invalidation Level
The bullish read on SIREN stays intact as long as the price holds above $0.03017 on a closing basis.
A confirmed close below that level would invalidate the accumulation setup and shift focus to $0.02769.
If the price instead breaks 0.03213 and holds above the range, that is treated as confirmation buyers have regained control after the earlier liquidity grab, with $0.03422 and $0.03548 next in view.
Siren Glossary
Rising Wedge: A converging price structure marked by higher highs and higher lows that narrow over time, often resolving with a breakdown once it completes.Accumulation Range: A sideways trading zone where price consolidates after a move, often building up positioning before the next directional push.Liquidity Grab: A sharp move beyond a visible level designed to trigger stop losses before price reverses back the other way.Liquidation: What happens when a leveraged trade gets forcibly closed because the trader ran out of margin to keep it open.
Analyst View
The liquidity grab below SIREN's accumulation range is the detail worth paying attention to, since price swept that lower zone and snapped straight back inside rather than continuing lower.
A confirmed break above 0.03213 and the range would support a move toward $0.03422 and possibly $0.03548. A close below $0.03017, on the other hand, would suggest sellers still have the upper hand, with $0.02769 becoming the next level to watch.
Given how heavily long liquidations have dominated over the past day, a clean range breakout would likely need fresh buying rather than just short covering to hold.
Disclamer:This article covers cryptocurrency, a Your Money or Your Life (YMYL) subject, and is for informational purposes only. It does not constitute financial, investment, tax, or legal advice, and nothing in it should be read as a recommendation to buy or sell any asset. Cryptocurrency markets, and presale or micro-cap tokens in particular, are highly volatile and carry a meaningful risk of total loss. Prices, on-chain figures, and project claims cited here reflect publicly available data as of the publish date and may change without notice. Readers should verify information independently and consult a licensed financial advisor before making investment decisions.