Solana price has extended its recovery to nearly 18% over the past week as record tokenized stock activity and growing institutional adoption helped the token outperform a crypto market still
Solana price has extended its recovery to nearly 18% over the past week as record tokenized stock activity and growing institutional adoption helped the token outperform a crypto market still weighed down by macroeconomic uncertainty.
Summary
- Solana price has rallied nearly 18% as record tokenized stock trading boosted network activity and investor demand.
- Technical indicators show bulls testing key resistance between $76 and $80, with liquidation clusters adding volatility.
- Analysts see room for further gains, though macroeconomic uncertainty and weaker support levels remain key risks.
According to data from crypto.news, Solana (SOL) climbed from a local low near $64 on June 25 to an intraday high of $75.8 on June 30 before easing back toward the $73 region. Its rebound came while Bitcoin remained below $60,000 following another failed breakout attempt, allowing SOL to stand out as one of the few large-cap cryptocurrencies to post a strong weekly gain.
One catalyst behind the move came from Solana’s tokenized asset ecosystem. The network processed a record $1.36 billion in weekly tokenized equity volume, accounting for roughly 96% of all on-chain stock trading during the period. The surge in real-world asset activity increased on-chain transactions and demand for SOL as the network’s native gas token, adding a source of organic spot buying beyond speculative trading.
Institutional adoption also continued to build. Spot Solana exchange-traded funds managed by firms including Bitwise and Fidelity surpassed $1.06 billion in combined assets under management. Unlike spot Bitcoin ETFs, several Solana products distribute staking rewards to shareholders, giving investors an additional yield component alongside price exposure.
Additionally, MoneyGram joined the network as a validator while Toss Bank expanded its use of Solana infrastructure for cross-border stablecoin remittances, adding another layer of long-term network participation.
You might also like: Singapore court grants $3M to Terraform UST collapse victims
Real-world asset growth has boosted demand for Solana
The 1-day chart shows Solana rebounding sharply after defending support near $64 earlier this week. Price has reclaimed the 20-day simple moving average around $70.9 and is trading above it, while the Chaikin Money Flow has climbed back into positive territory at 0.17, suggesting capital has returned after weeks of persistent selling pressure.
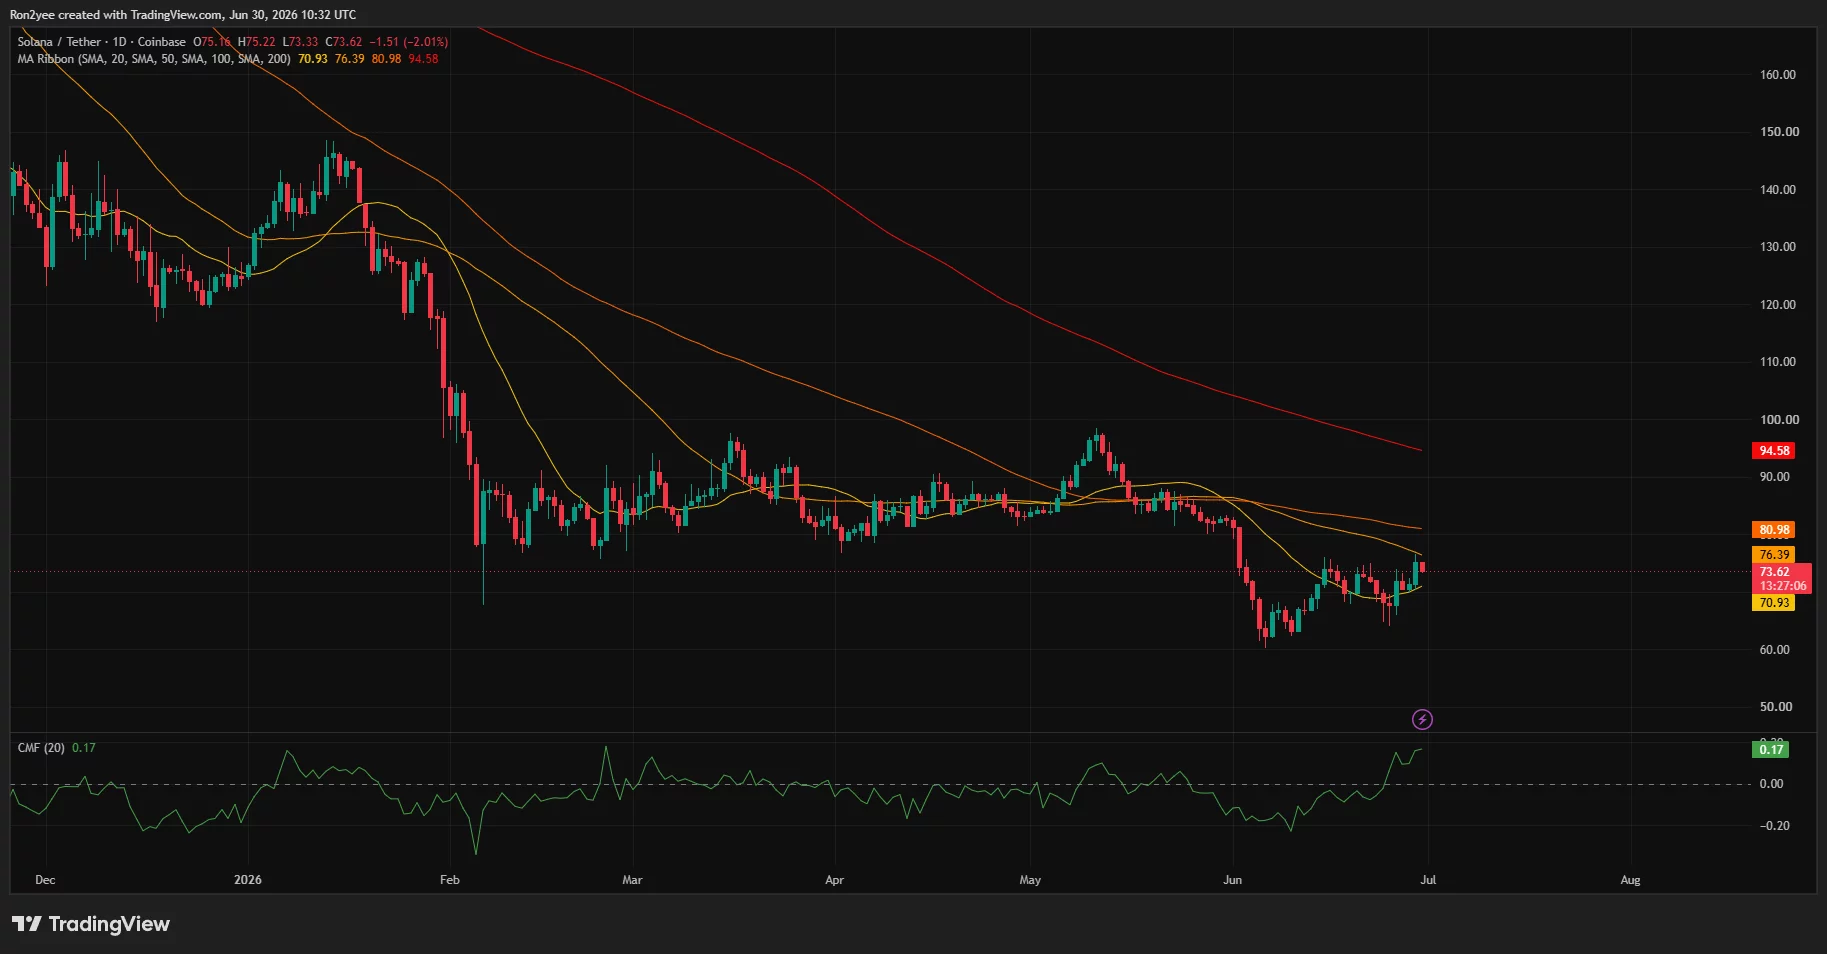
Solana 1-day price chart — June 30 | Source:
crypto.newsYet, SOL remains below the 50-day, 100-day and 200-day moving averages near $76.4, $81.0 and $94.6 respectively, leaving a heavy resistance band overhead.
The 4-hour chart paints a constructive short-term picture despite Tuesday’s pullback. Solana completed a strong recovery from the June 25 low and briefly pushed above the 0.786 Fibonacci retracement level at $73.85 before reaching $76.49.
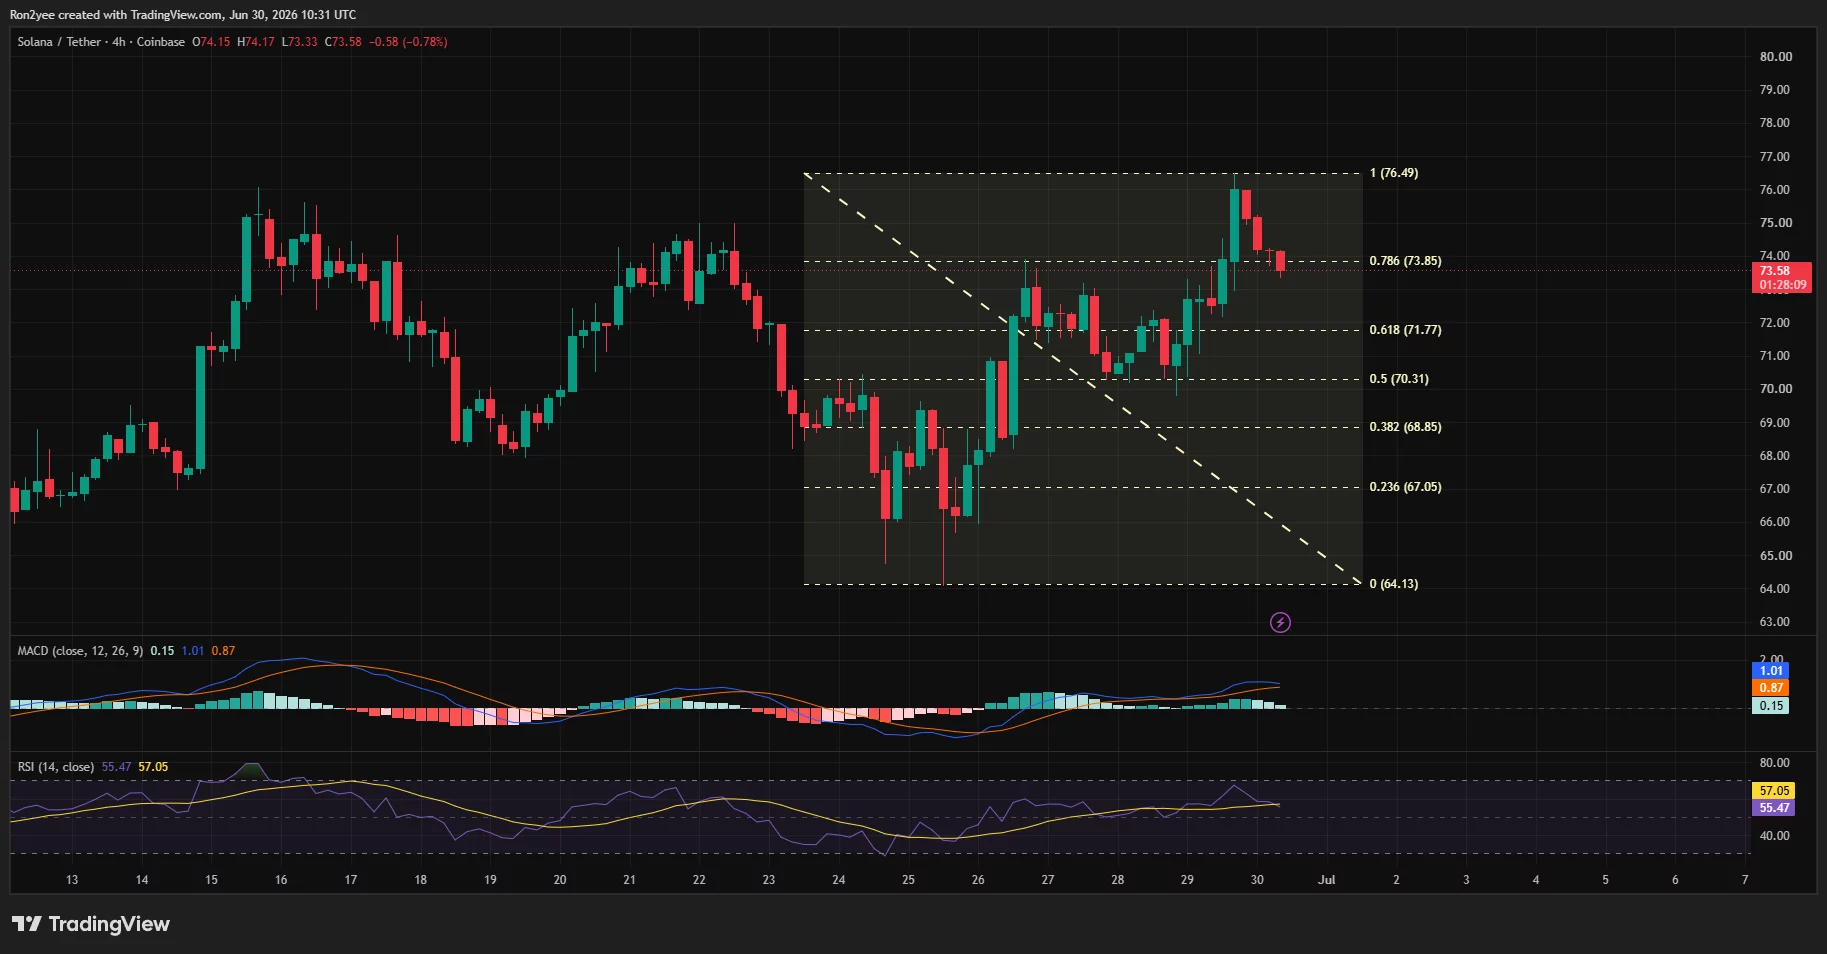
Solana 4-hour price chart — June 30 | Source:
crypto.newsMomentum has eased since then, with the MACD histogram beginning to contract while the RSI has slipped to around 55 after briefly approaching overbought territory. Holding above the 0.618 Fibonacci level near $71.8 would keep the current recovery intact, while a sustained move above $76.5 could expose the next psychological resistance near $80.
Derivatives positioning suggests volatility may not be over. CoinGlass liquidation data shows dense short liquidation clusters between $74 and $76, helping explain the sharp squeeze that carried SOL to its weekly high. Another sizeable concentration of leveraged positions sits around the $72 area, while heavier long liquidation pockets extend toward $69 and $66.
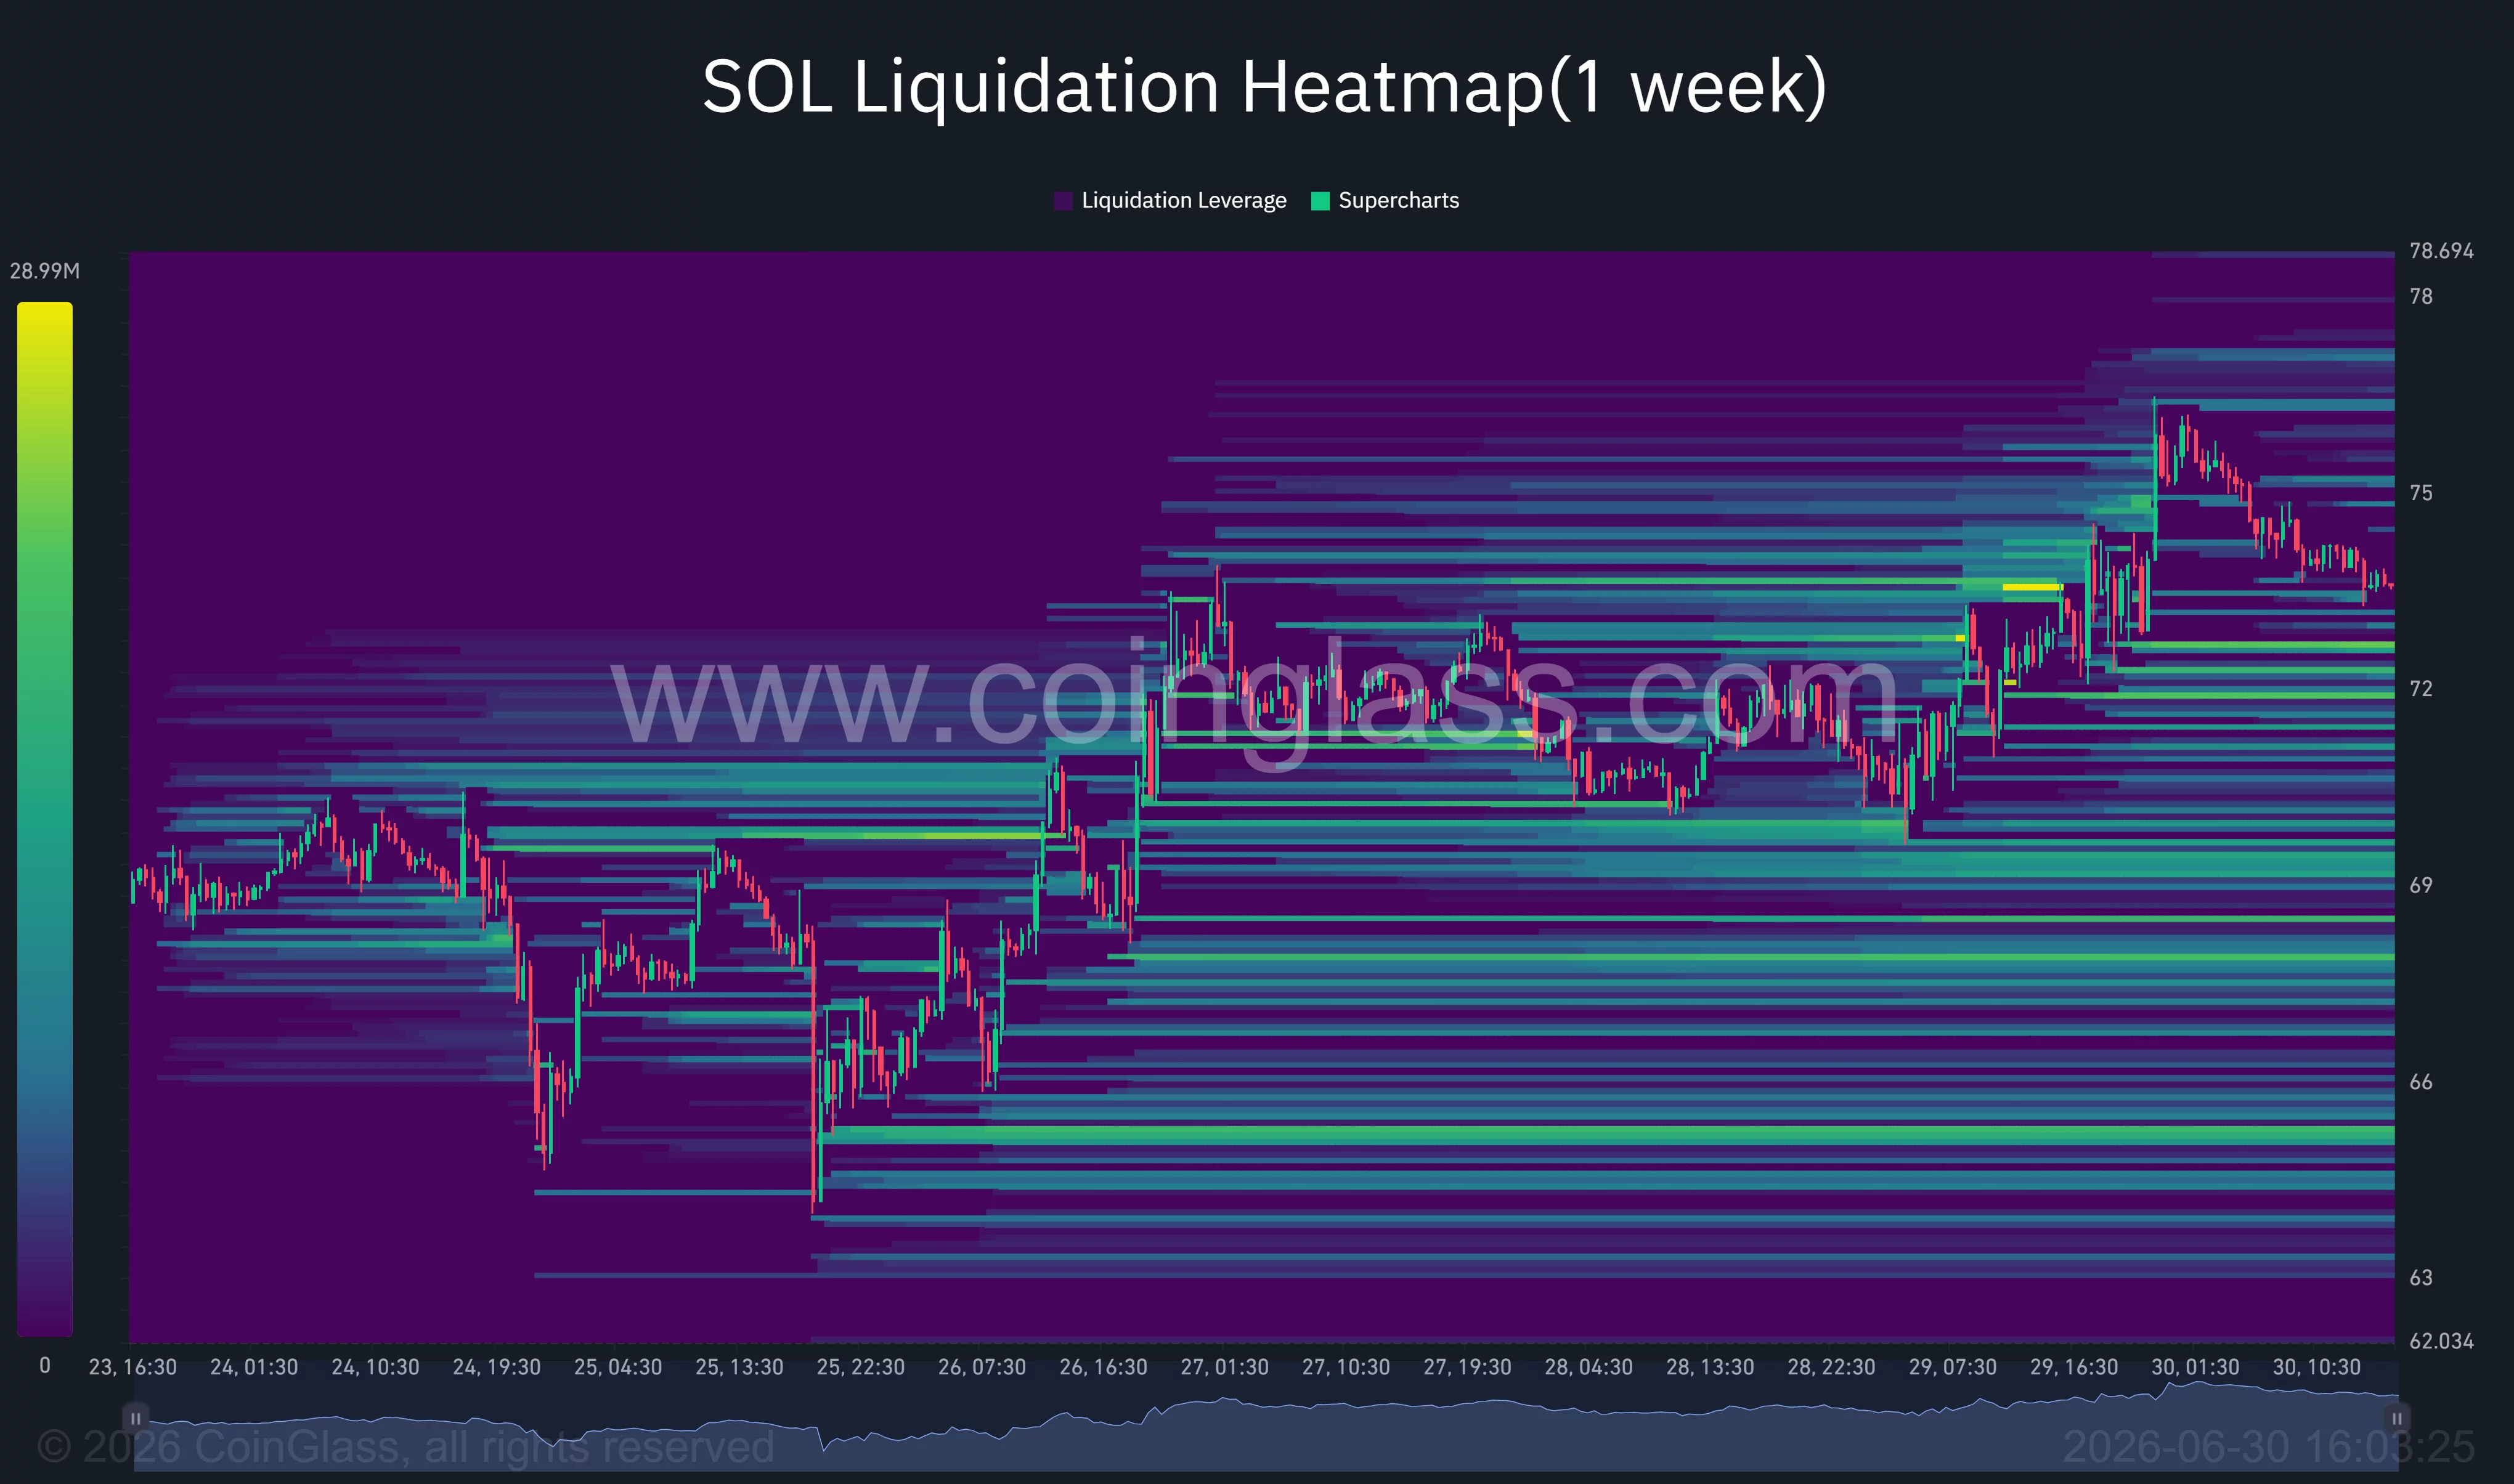
Solana liquidation heatmap | Source:
CoinGlassA clean break above $76 could trigger another wave of short liquidations, whereas losing $72 may accelerate downside as leveraged longs begin to unwind.
Commenting on the market structure, well-followed analyst Michaël van de Poppe wrote:
“The flip is an easy buy opportunity for me, but overall, I think that the markets are looking to get more upside momentum and I would expect $120-130 as a potential target area in Q3/Q4 of this year.”
Another optimistic assessment came from fellow analyst Ardi, who argued Solana could be repeating Ethereum’s 2022 recovery pattern. He noted that reclaiming the 21-week exponential moving average near $85 would strengthen the case that SOL has already established its cycle low.
Support at $72 remains crucial for the bullish outlook
Despite Solana’s relative strength, macro conditions continue to present meaningful risks. Markets remain under pressure after the latest U.S. Core PCE inflation reading came in above expectations, reinforcing the possibility that the Federal Reserve could keep interest rates elevated for longer. Rising Treasury yields and continued demand for defensive assets have already weighed on cryptocurrencies, with Bitcoin struggling to regain the $60,000 level.
From a technical standpoint, failure to hold above the $71.8-$72 support region would weaken the current recovery and shift attention back toward $69 and the recent swing low near $64.
On the upside, reclaiming the cluster of moving averages between $76 and $81 would provide the first convincing signal that Solana’s recent rally is developing into a broader trend reversal rather than another relief bounce within its longer-term downtrend.
Disclosure: This article does not represent investment advice. The content and materials featured on this page are for educational purposes only.
Read more: Kalshi hit with temporary Michigan ban over sports event contracts