Solana price has delivered a strong recovery from its recent lows, but the strength of that move may hide a less bullish structure underneath. SOL climbed from around $77 to nearly $87 yester
Solana price has delivered a strong recovery from its recent lows, but the strength of that move may hide a less bullish structure underneath. SOL climbed from around $77 to nearly $87 yesterday, putting an important resistance level back within reach after a difficult period for the token.
Veteran financial trader Matthew Dixon believes the recovery deserves some caution. His Elliott Wave analysis indicates that SOL could still be inside a corrective rally instead of beginning a fresh bullish impulse. That distinction matters because the current advance could eventually give way to another move lower if his interpretation proves correct.
Solana’s short term indicators provide another reason to examine that possibility. RSI has already entered deeply overbought territory, even though other momentum indicators remain positive.
Matthew Dixon Says Solana Price Rally Looks Corrective Despite Its Strength
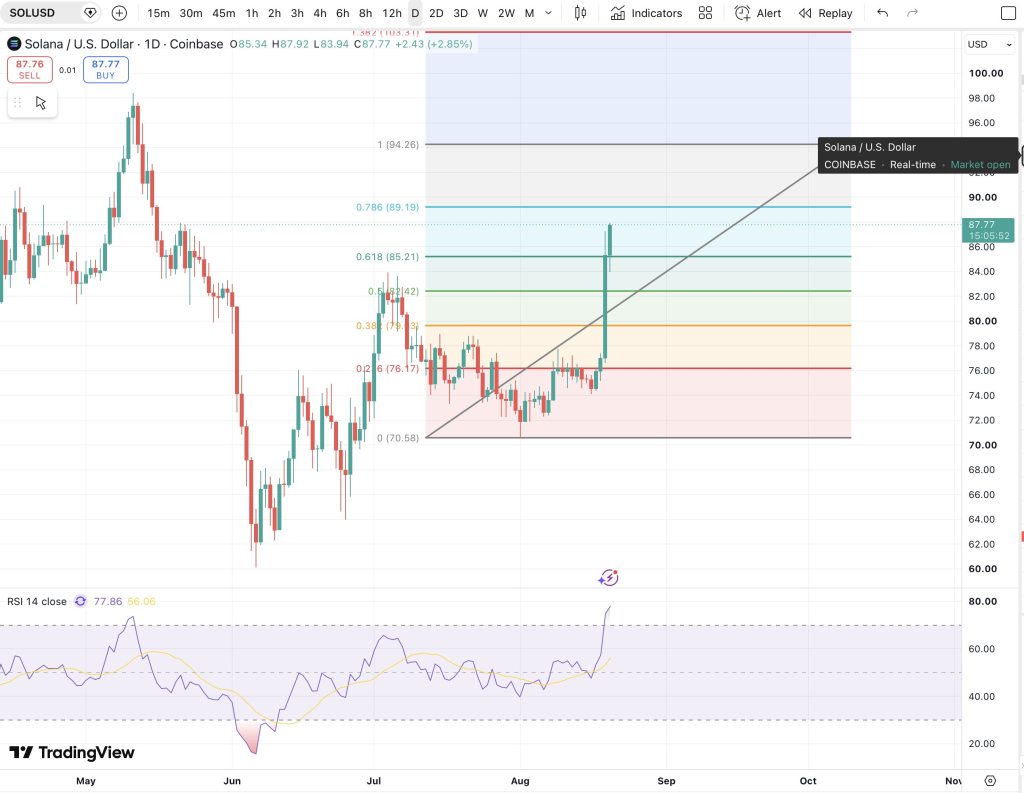
Matthew Dixon explained that the internal structure of Solana’s current recovery does not resemble the clean 5-wave advance he would expect from a new bullish Elliott Wave impulse.
The key issue in his analysis is overlap between the waves.
A normal bullish impulse usually develops through a recognizable 5 wave structure. Dixon instead favors a 3 wave corrective interpretation for the current Solana price recovery.
@mdtrade / X
That means the rally could represent an A, B, C correction inside a broader bearish structure.
The strength of the latest SOL move does not invalidate that interpretation. Dixon explained that C waves can become extremely powerful and resemble bullish impulses during their development.
His analysis therefore focuses on several important factors:
- SOL’s internal structure contains overlap that weakens the 5 wave bullish interpretation.
- Dixon currently favors a 3 wave corrective structure for the recovery.
- A strong C wave can look extremely bullish before the correction ends.
- Solana RSI has moved into overbought territory.
- SOL price is getting closer to upper Fibonacci targets identified in his analysis.
Dixon summarized his view with a simple message: “Structure over excitement.”
Solana Could Face Another Impulsive Drop After The Corrective Rally Ends
Dixon’s analysis becomes particularly important when considering what could happen after the current Solana price advance reaches completion.
His Elliott Wave interpretation leaves room for another impulsive move lower. Such a decline could potentially retrace the entire corrective advance if the current structure develops as expected.
That possibility would mean SOL’s recovery from around $77 should not automatically be treated as confirmation that a durable bottom has formed.
SOL Price Chart / TradingView.com
Solana’s overbought RSI also deserves attention here. Strong RSI readings can remain elevated during powerful rallies, so an overbought reading does not automatically mean price must reverse immediately.
However, an extreme RSI reading combined with upper Fibonacci targets and a potentially corrective Elliott Wave structure creates a more complicated picture.
SOL could therefore continue higher before Dixon’s bearish scenario becomes relevant. The important question is whether the current advance eventually develops into a convincing bullish impulse or completes the 3 wave structure he currently favors.
Solana Price Recently Climbed 13% As SOL Tested The $87 Resistance
An earlier analysis today examined the short term Solana price outlook and the levels that could determine its next move.
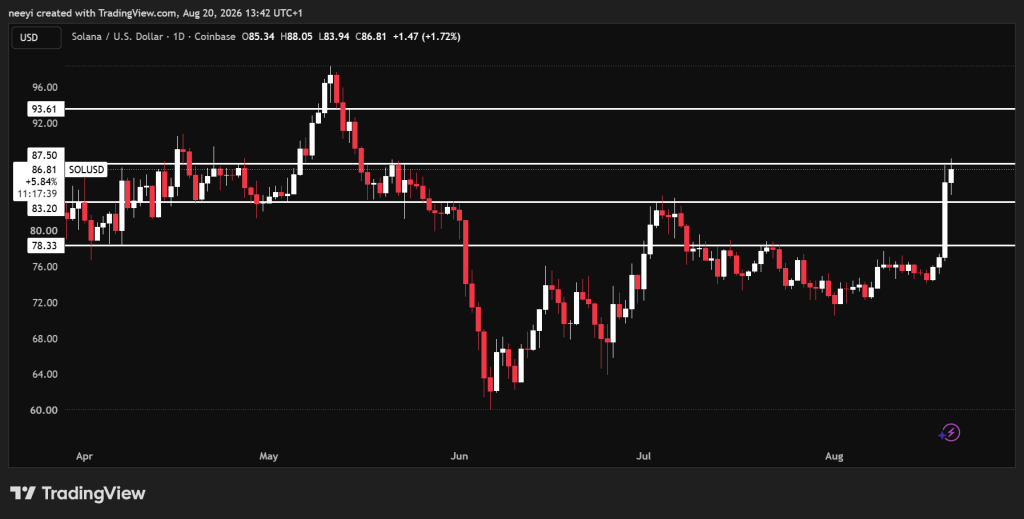
SOL climbed roughly 13% yesterday from around $77 to a high near $87. Solana later gave back part of that advance but still closed close to $85.
The $87 area now represents the immediate level to watch.
A break above $87 could open the path toward $93 if buyers maintain control. Failure to clear that resistance could keep Solana price between approximately $83.20 and $87.
The bearish short term scenario begins to become more relevant below $83. A sustained move beneath that area could send SOL back toward approximately $78.
Those levels create a useful framework for comparing the immediate Solana price outlook.
ScenarioImportant LevelPossible SOL Price OutcomeBullishSOL breaks above $87Price could extend toward $93NeutralSOL remains below $87 but above $83.20Price could remain between $83.20 and $87BearishSOL loses $83 supportPrice could return toward $78
Dixon’s broader Elliott Wave warning does not necessarily conflict with the possibility of SOL reaching $93 first. A corrective C wave can continue higher before completing, which means another push upward could still fit his interpretation.
Solana RSI Reaching 85 Adds Weight To The Correction Risk
A look at Solana’s 5 hour indicators shows that momentum remains strongly positive, although RSI provides a clear warning.
RSI(14) currently stands at 85.299. That places SOL deep inside overbought territory after its rapid recovery.
STOCH(9,6) remains at 59.241, which supports continued short term strength without reaching an extreme reading. MACD(12,26) stands at 2.116 and remains positive.
Bull/Bear Power(13) also comes in at 9.636, which shows buyers currently maintain an advantage.
IndicatorValueCurrent ReadingRSI(14)85.299Deeply overboughtSTOCH(9,6)59.241Short term strength remains intactMACD(12,26)2.116Positive momentum remains presentBull/Bear Power(13)9.636Buyers currently maintain control
RSI is particularly relevant because Dixon independently identified the overbought condition as part of his Elliott Wave analysis. Solana price therefore enters an interesting stage after its recovery from $77.
The immediate setup still gives buyers opportunities. A clean move beyond $87 could take SOL toward $93, and several short term indicators remain supportive.
Dixon’s analysis provides the larger warning. The veteran trader does not currently view the rally as convincing evidence of a fresh bullish impulse. His preferred 3 wave interpretation leaves open the possibility that SOL eventually gives back much of its recent recovery.
FAQs
Can Sol reach $1000 USD?Yes, Solana (SOL) can realistically reach $1,000 USD, but it requires a massive shift in market capitalization and broader crypto adoption. Reaching $1,000 means SOL’s market cap would need to climb to roughly $470 to $540 billion (depending on the circulating supply at that time), placing it near Ethereum’s historical peak valuations.
Will Solana hit $200 again?Solana (SOL) can hit $200 again, but it faces heavy resistance. Trading around $75 to $85 in August 2026, SOL sits roughly 70% below its all-time high of $294. Reaching $200 requires a major shift in market momentum, broader crypto liquidity, and macro conditions.
Subscribe to our YouTube channel for daily crypto updates, market insights, and expert analysis.
The post Solana Price Rally May Be a Trap as Veteran Trader Expects Another Leg Lower appeared first on CaptainAltcoin.