Solana price has held above key technical support even after slipping 1.7%, while U.S.-listed spot Solana ETFs have continued attracting fresh inflows as Bitcoin and Ethereum funds recorded w
Solana price has held above key technical support even after slipping 1.7%, while U.S.-listed spot Solana ETFs have continued attracting fresh inflows as Bitcoin and Ethereum funds recorded weekly withdrawals.
Summary
- Solana held above key support as $5.75 million in spot ETF inflows contrasted with Bitcoin and Ethereum fund outflows.
- Solana ranked second in weekly spot trading volume, while non-vote transactions topped 1 billion for the first time.
- Rising active users, strong DApp revenue, and bullish technical indicators continue to support Solana’s recovery.
After climbing more than 15% last week, Solana (SOL) price met selling pressure near the $80 level, where traders again defended resistance amid the broader market pullback. Even after the recent recovery, the token remains about 73% below its all-time high of $294.33 reached on Jan. 19, 2025.
Meanwhile, Bitcoin fell 1.65% during the same period, dragging the total cryptocurrency market capitalization down 1.47% to $2.14 trillion.
ETF demand has stayed positive despite market weakness
Fund flow data showed Solana diverging from the two largest cryptocurrencies during the latest reporting period. Spot Bitcoin ETFs recorded net outflows of $527 million between June 29 and July 2, extending their losing streak to eight consecutive weeks. Spot Ethereum ETFs also registered net outflows totaling $13.67 million.
By contrast, U.S.-listed spot Solana ETFs attracted $5.75 million in net inflows over the same period. The inflows indicated that investors continued adding exposure despite weakness across the wider digital asset market.
Capital also moved into several other altcoin investment products. XRP ETFs recorded $17.19 million in net inflows, while HYPE ETFs added another $4.32 million during the week.
You might also like: Vitalik Buterin unveils Ethereum’s biggest overhaul since The Merge
Away from fund flows, on-chain activity continued to strengthen. According to SolanaFloor, Solana ranked second in global spot crypto trading volume for the second consecutive week, processing $12.25 billion across centralized and decentralized exchanges. That total remained ahead of Bybit’s $10.57 billion, although Binance retained the top position among exchanges during the reporting period.
SolanaFloor also reported that weekly non-vote transactions surpassed one billion for the first time. Unlike validator voting activity, non-vote transactions represent actual network usage generated by users, decentralized applications, and traders. The sharp rise at the beginning of July points to heavier activity across the ecosystem.
Technical structure still favors buyers above key support
Network participation has accelerated alongside the recovery. According to Artemis data, Solana’s weekly active addresses climbed from 16.8 million to 29.7 million in just two weeks, an increase of roughly 12.9 million wallets, or about 76.8%. The rebound followed slower activity during June as users returned to decentralized applications across the network.
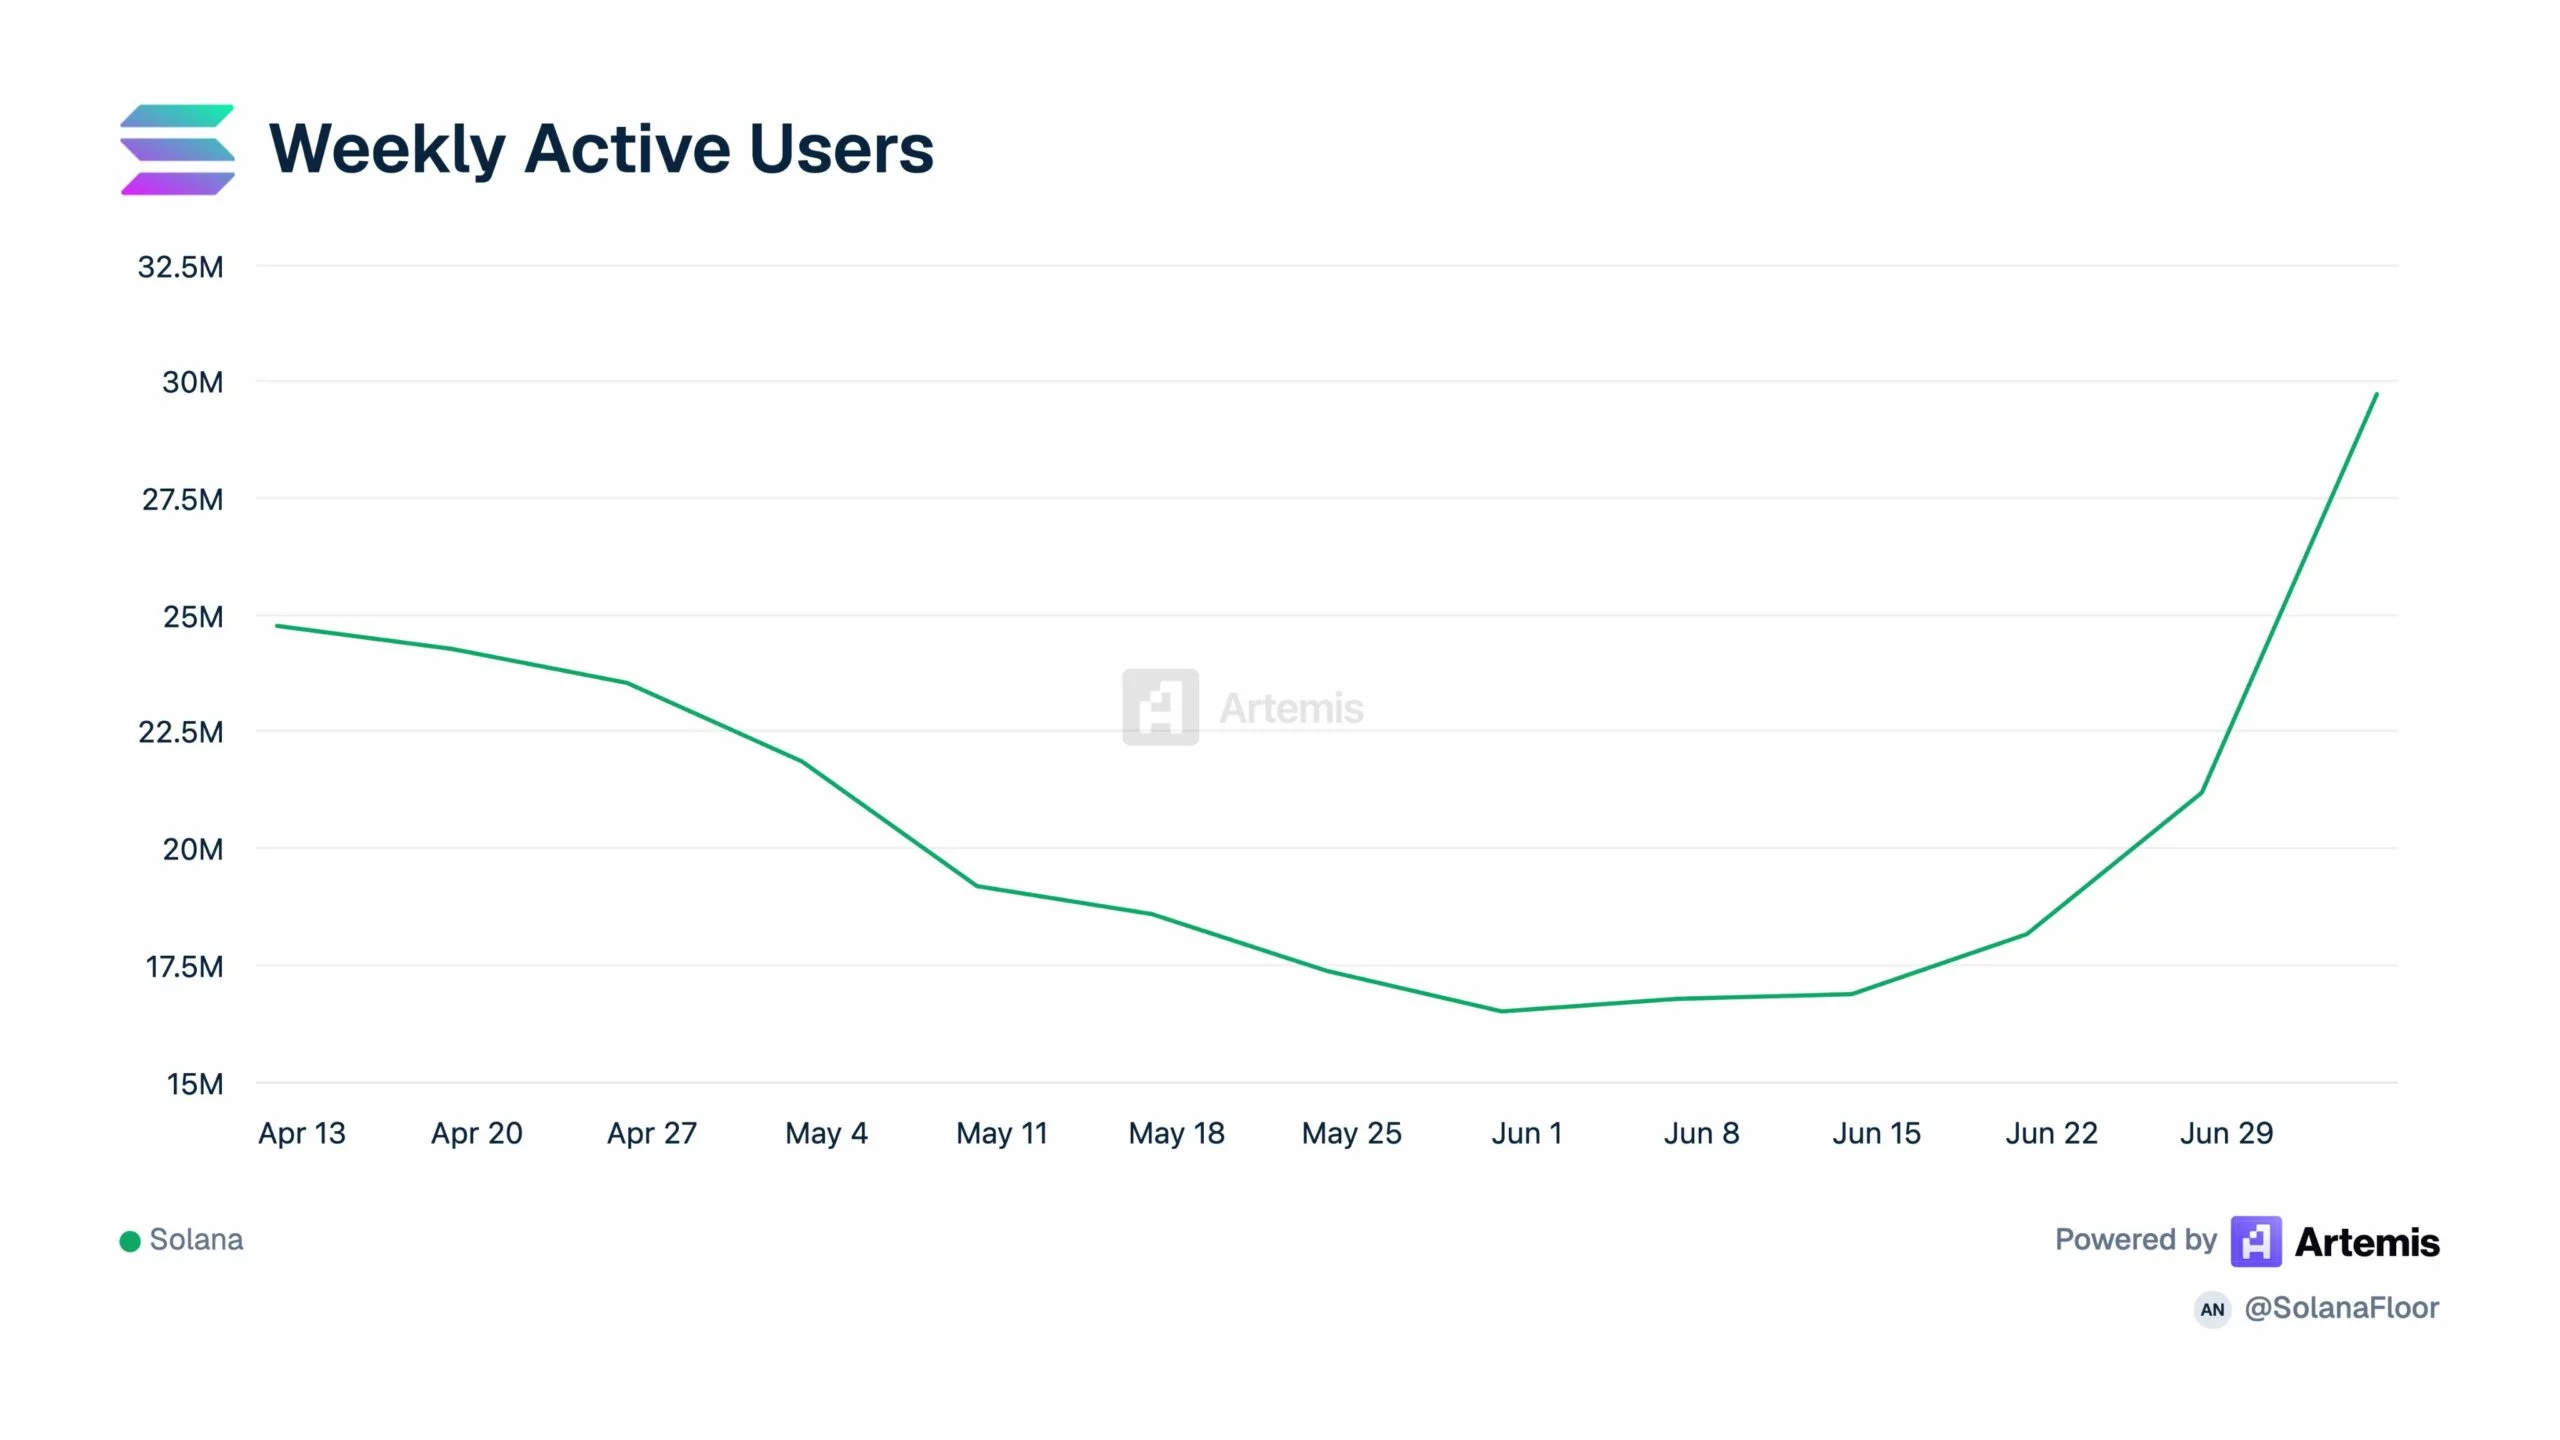
Source: Artemis
Separate ecosystem rankings also kept Solana at the top of several blockchain activity metrics. The network led all Layer 1 and Layer 2 chains in both 24-hour and seven-day decentralized application revenue while also recording the highest decentralized exchange trading volume over those periods. Polygon, Ethereum, Base, BNB Chain and Hyperliquid followed behind across the tracked categories.
Price action continues to support the improving network data. On the daily chart, Solana remains above its 20-day, 50-day and 100-day moving averages, while the MACD indicator is still in bullish territory despite momentum easing after last week’s rally.
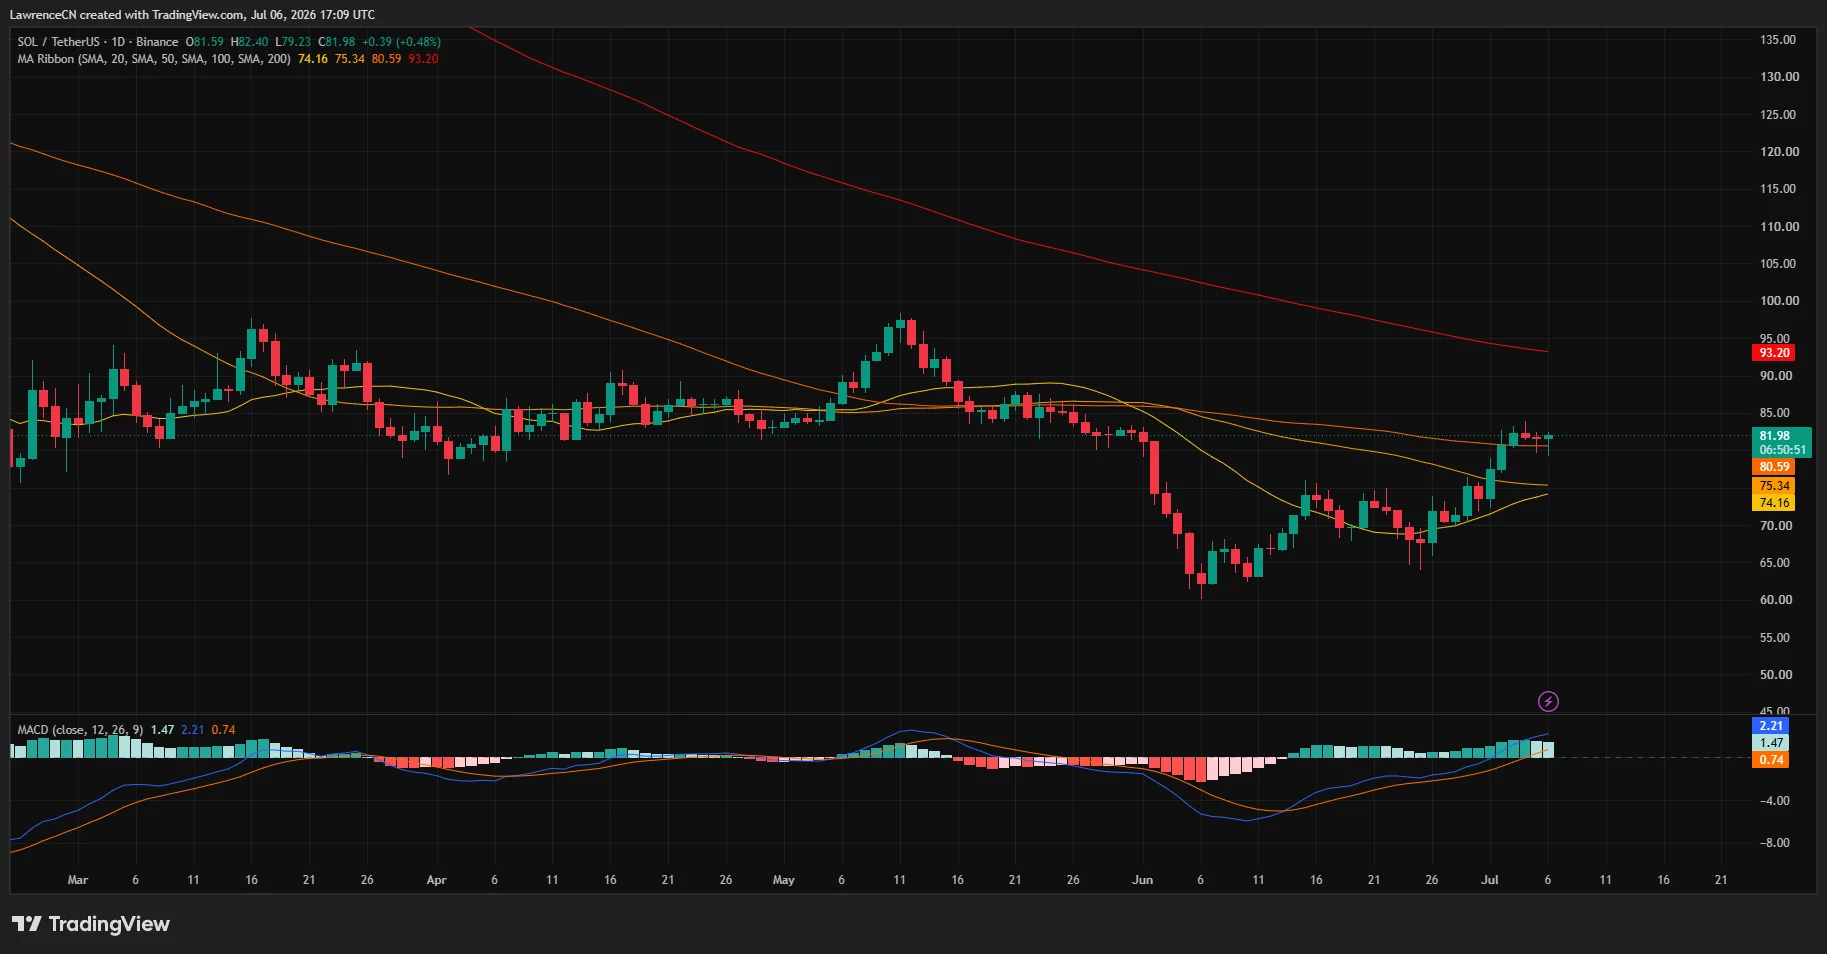
Solana daily price chart — July 6 | Source:
crypto.newsOn the 4-hour chart, the Supertrend indicator continues to hold below price near $78.30, and Chaikin Money Flow has stayed slightly above zero, indicating modest buying pressure.
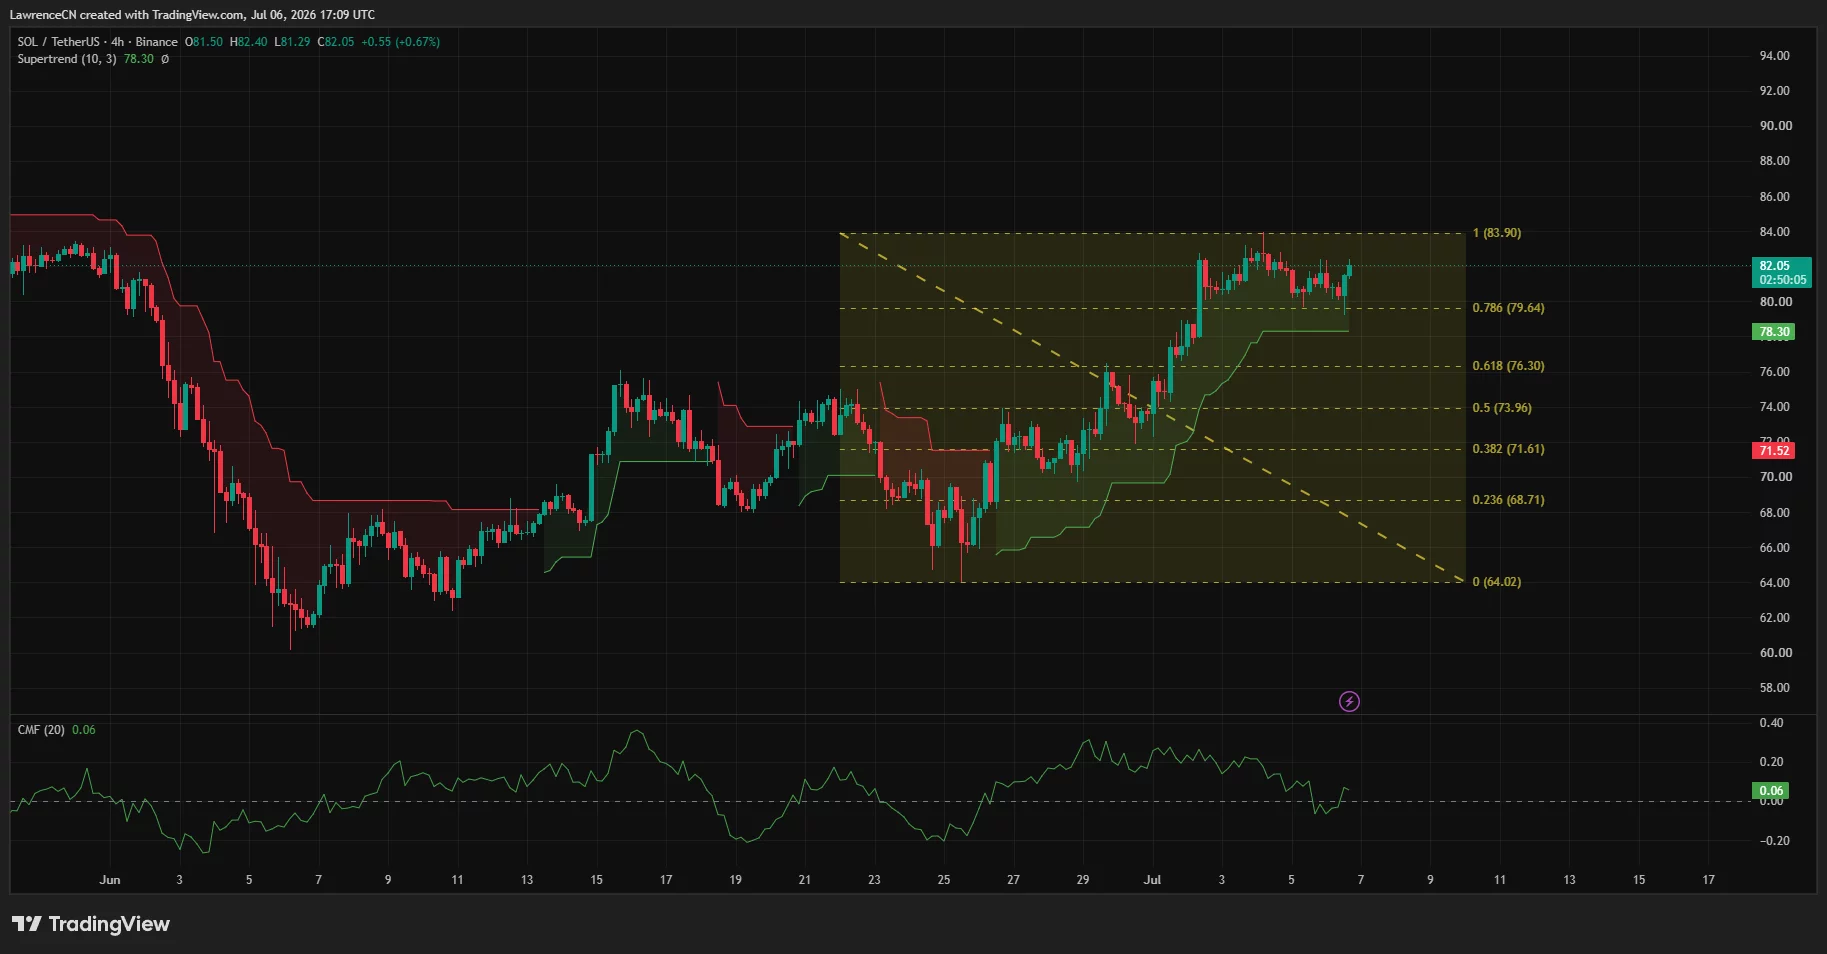
Solana price 4-hour chart — July 6 | Source: crypto.news
The latest consolidation has left immediate resistance around the recent high near $84, while the Supertrend level near $78 and the Fibonacci support around $76 remain the first areas buyers may need to defend if selling pressure returns. Together with steady ETF inflows and rising network activity, those technical levels suggest Solana’s recovery remains intact unless those support zones give way.
Disclosure: This article does not represent investment advice. The content and materials featured on this page are for educational purposes only.
Read more: Bitmine defies Strategy selloff as Ethereum bet lifts BMNR stock