Key Takeaways SOL $79.57, down 2.63%, low $77.92. Price 10.6% below the 200-day SMA at $88.98. 0.618 near $84.72 lost; 0.786 near $73.82 next. Down 36% from the $124.80 October peak. Coindoo’
Key Takeaways
- SOL $79.57, down 2.63%, low $77.92.
- Price 10.6% below the 200-day SMA at $88.98.
- 0.618 near $84.72 lost; 0.786 near $73.82 next.
- Down 36% from the $124.80 October peak.
Coindoo’s November 10 update had SOL at $82, with $81.34 as the last support inside its two-week range and $78.68 as the first level beneath it. Both have now traded. The figures here are from the Binance daily chart at 06:25 UTC on Friday.
−36%
from the October peak
−10.6%
below the 200-day
SMA
7.2%
to the 0.786 near $73.82
Five weeks, four levels
Solana’s decline from $124.80 has had a rhythm to it. The 0.236 near $109.50 went in the first half of October. The 0.382 near $100.03 went at the start of November, taking the $100 mark and the 100-day average with it. The 200-day followed on November 8, the 0.5 near $92.37 was gone by then too, and the 0.618 near $84.72 lasted less than a day once Tuesday’s inflation print hit. Each level has held for less time than the one above it.
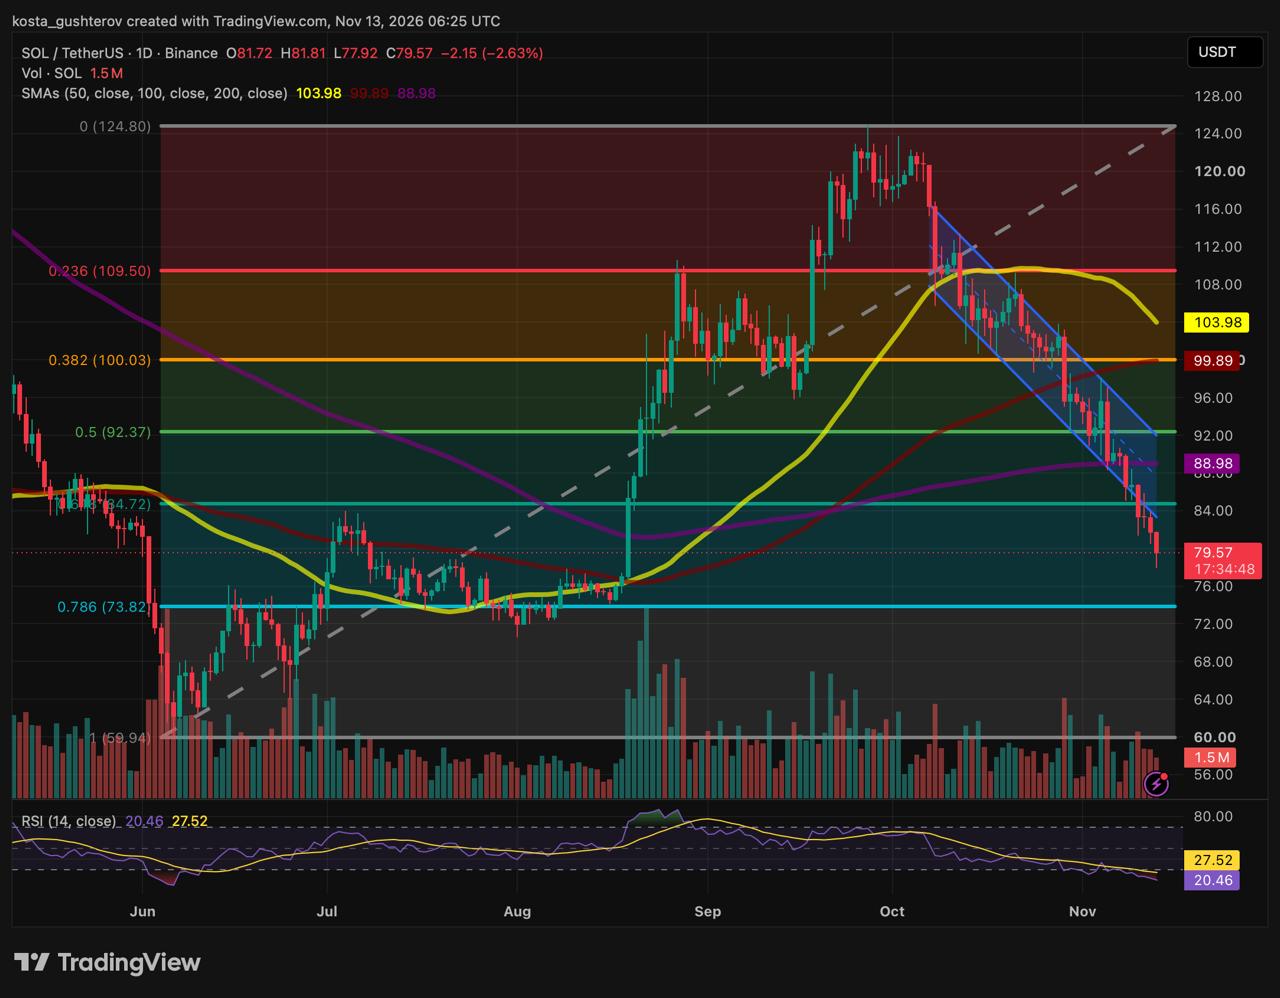
Solana daily SOL/USDT technical analysis chart for November 13 showing a decline to $79 /
Source: TradingView
Friday’s candle opened at $81.72, got no higher than $81.81 and fell to $77.92 before settling at $79.57 with 17 hours left. That low is beneath the $78.68 extension Coindoo’s last update named as the first stop under $81.34, which leaves the $76.03 extension and then the daily 0.786 near $73.82 as the only marked levels before the retracement grid runs out at $59.94.
What $73.82 is
The 0.786 means Solana would have given back more than three quarters of the June-to-October rally. On the chart it is also roughly where SOL spent July and the first half of August, a range between the low $70s and the high $70s that it only left in mid-August. A return there would put price back among holders who bought before the autumn run existed, which is usually where selling slows, if not where it stops.
It is 7.2% below the current price. The 200-day, the first level that would have to be recovered to change the trend reading, is 11.8% above it. Downside to the next support is smaller than the distance back to the first meaningful resistance, and that asymmetry is the clearest description of where SOL stands.
Three layers of ceiling
Everything above price is now resistance, arranged in layers. The first is the 0.618 near $84.72, which was support on Monday and the lower boundary of the descending channel SOL left on Tuesday. The second is the 200-day at $88.98, sitting just under the 0.5 near $92.37. The third is the pair at $99.89 and $103.98, the 100-day and 50-day averages, with the 0.382 near $100.03 between them and the 50-day now turning down. SOL has lost 36% from its peak in five weeks; a return to that third layer would require a rally of more than 25%.
If this, then that
If SOL closes under $77.92. Friday’s low becomes the ceiling for the weekend and the $76.03 extension is the next reference, with the 0.786 near $73.82 behind it. A daily close through $73.82 would leave nothing on the grid until $59.94.
If SOL holds $77.92 but stays under $84.72. A bounce inside the broken structure. The 0.618 is the first test; failure there would set up another attempt at the lows with a lower high in place.
If SOL closes back above $84.72. The channel floor is reclaimed and the 200-day at $88.98 comes into range, about 11.8% above today’s price. Only a daily close above the 200-day would turn a bounce into a change of trend.
Why the bounce case is weaker than it looks
For now it looks like the relief case deserves more scepticism here than usual. Solana has fallen further and faster than Bitcoin or ether, it sits deeper below its 200-day than either, and the last two levels that should have produced a bounce, $84.72 on Monday and $81.34 on Tuesday, produced none.
A rebound toward $89 is possible from any oversold reading, and the market has had several this week without one arriving. Until SOL closes a day above $84.72, the working assumption is that rallies are selling opportunities for whoever is still holding from higher up, and that the next level that matters is the one below.
This article is for informational purposes only and is not financial or investment advice. The levels and scenarios described are based on technical analysis of public chart data and do not guarantee future price movements. Cryptocurrencies are volatile, so do your own research before making any trading or investment decision.
The post Solana Price Slides to $79 – Where the Next Floor Could Be appeared first on Coindoo.