Solana applications generated about $6.56 million in 24-hour revenue against roughly $3.22 million for Robinhood Chain, a better-than-two-to-one gap, according to unconfirmed reports carried
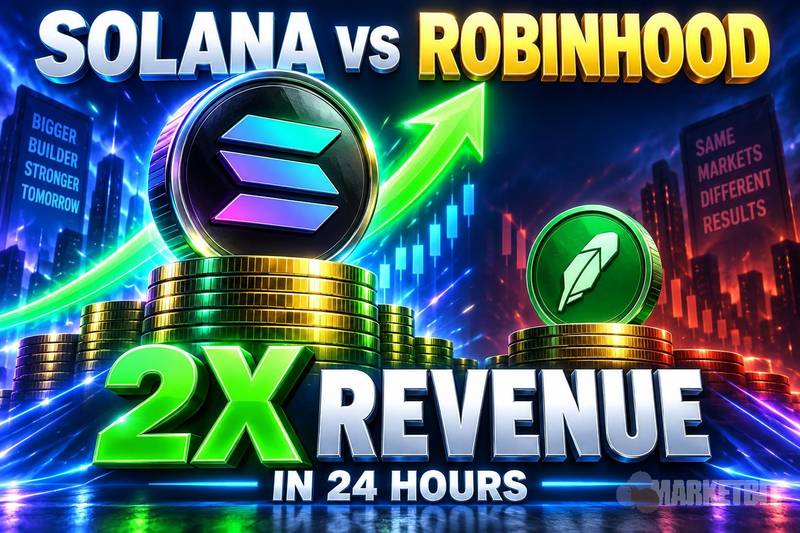
Solana applications generated about $6.56 million in 24-hour revenue against roughly $3.22 million for Robinhood Chain, a better-than-two-to-one gap, according to unconfirmed reports carried by crypto media on September 9, 2026. The comparison measures application revenue, not chain revenue, and no matched primary dataset was verified for either total.
- The reported result: A single social-post-derived report put Solana at roughly twice Robinhood Chain's 24-hour figure, unverified against a primary dataset.
- Measurement matters: The report describes application revenue, which is distinct from chain-level revenue and from Robinhood's corporate revenue.
- Snapshot limits: One 24-hour observation does not establish sustained leadership, adoption, or price direction.
Solana's Reported 24-Hour Revenue Leads Robinhood Chain
The comparison originates from a U.Today report published September 9, 2026, which cited a linked social post rather than a reproducible dataset. The outlet reported approximately $6.56 million for Solana and $3.22 million for Robinhood Chain over a 24-hour window. For related coverage, see Bitcoin ETF Adds $100 Million as Solana, XRP, Ethereum ETFs Stay Red.
The same report ranked BSC at about $3.26 million, Hyperliquid L1 at roughly $1.94 million, and Ethereum near $1.59 million, with Base outside the top five, according to unconfirmed reports. These are secondary figures without a fetched underlying table. For related coverage, see PolyNext Awards & Conference Dubai 2026: Advancing the Global Dialogue on Plastic Recycling and Circularity.
SOL traded at $104.10, up 2.27% over 24 hours, with a market capitalization near $61.06 billion and volume of about $2.86 billion at the research snapshot. That window does not match the reported revenue observation period. Solana's fee dynamics were previously in focus when network fees hit a record as validators doubled the inflation-cut pace.
How the Chain Revenue Comparison Is Measured
The reported figures describe application revenue, the fees captured by protocols built on each network, not chain revenue paid to the base layer. U.Today's body and summary both use the application-revenue label, while the supplied headline calls it chain revenue. For related coverage, see Bitcoin Holds as Oil Shock Revives Fed Hike Bets.
Those are not interchangeable. DeFiLlama's Solana daily-revenue metric returned $88,658 over 24 hours in the research snapshot, a base-layer figure roughly two orders of magnitude below the reported $6.56 million application total.
Solana chain revenue: 24-hour research snapshot
$88,658 USD
DeFiLlama's Solana chain-revenue snapshot returned $88,658 USD in the supplied research completed September 9, 2026. This is a separate metric from application revenue and does not establish the reported Solana–Robinhood Chain comparison. The exact observation window was not supplied; the linked public dashboard may show newer values.
DeFiLlama's Solana methodology notes that 50% of transaction base fees are burned, and that its priority-fee burn revenue applied before February 12, 2025, differences that further separate chain revenue from application take. The observation interval, protocol inclusion rules, and Robinhood-side methodology behind the reported comparison were not disclosed.
Robinhood describes Robinhood Chain as a permissionless Layer 2 built for financial services and real-world assets, developed on Arbitrum infrastructure with advertised 100ms block times. It says the chain supports tokenized Stock Tokens tied to NVIDIA, Google, and Apple, which are not available in the US and are restricted in other jurisdictions. Prior on-chain activity there included ETH bridging up 150%.
What the One-Day Revenue Gap Can Tell Us
The reported two-to-one figure is a single 24-hour observation subject to verification, not a trend line. The research contains no historical revenue series, transaction counts, or user metrics to explain the gap.
A one-day revenue ratio alone does not establish sustained leadership, adoption, profitability, or token-price direction. Assessing persistence would require repeated measurements under a consistent methodology across additional periods.
Broad sentiment sat at 66 on the Crypto Fear & Greed Index, classified as Greed, at 00:00 UTC on September 9, 2026, a market-wide reading rather than a Solana-specific one. Until a matched primary dataset publishes both totals with an identical window and definition, the comparison should be read as a reported claim, not a confirmed result.
Disclaimer: This article is for informational purposes only and does not constitute financial or investment advice. Cryptocurrency and digital asset markets carry significant risk. Always do your own research before making decisions.
Read original article on marketbit.net