Solana (SOL) is trading at $111.93 today, up 5.06% in the last 24 hours. That is SOL's highest price in seven months. This Solana price prediction looks at what is driving the move and whethe
Solana (SOL) is trading at $111.93 today, up 5.06% in the last 24 hours. That is SOL's highest price in seven months.
This Solana price prediction looks at what is driving the move and whether SOL can climb toward $155 next.
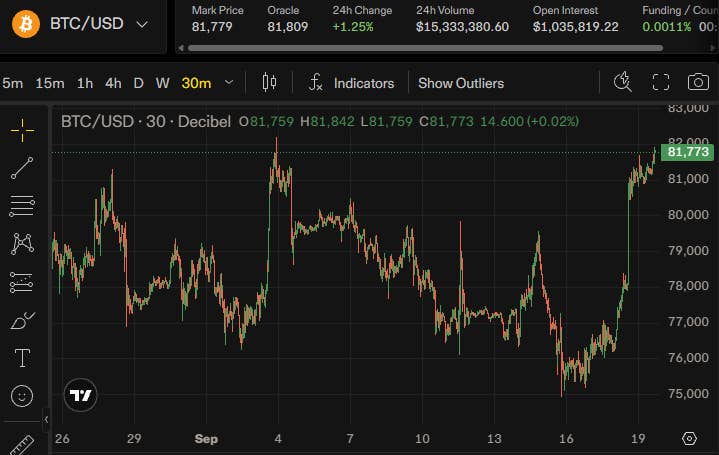
The wider crypto market rose 3.70% to a total value of $2.78 trillion. Bitcoin broke above $80,000, and Ethereum moved back over $2,600.
What Is SOL's Market Cap and Supply Today?
SOL has a market cap of $65.79 billion. Circulating supply stands at 587.29 million SOL, out of a total supply of 634.29 million. There is no fixed max supply.
Why Is SOL Price Up Today?
Traders are rotating money into altcoins, and SOL is leading that move. It broke above the $110 mark for the first time in months.
Part of the reason is news out of Washington. The CFTC sent new crypto market rules to the White House for review. This came just days after the CLARITY Act failed to move forward in the Senate.
Traders read the CFTC filing as a positive sign. Clearer rules could mean less uncertainty for crypto businesses operating in the United States.
XRP also rose more than 6% during the same stretch. That points to broad capital rotation across altcoins, not a move tied to one token alone.
How Much Money Flowed Into SOL ETFs?
Spot ETFs tracking the token had their best day of the month on September 18. Daily net inflows reached $47.62 million, according to SoSoValue data.
Bitwise brought in the full $47.62 million on its own that day. Cumulative net inflow into these funds now stands at $1.42 billion.
Total net assets held across the funds are $1.62 billion. That is about 2.11% of the current market cap.
What Is SOL's Futures and Open Interest Data?
The derivatives market is active right now. Here is a snapshot of the key numbers.
Metric
Value
24h Change
Futures Volume (24h)
$11.69B
+30.31%
Spot Volume (24h)
$1.24B
-
Open Interest
$6.87B
+5.32%
Options Volume
$25.65M
-17.72%
Options Open Interest
$175.19M
+1.92%
Market Cap
$65.79B
-
What Is the SOL Long/Short Ratio Right Now?
The overall 24-hour long/short ratio sits at 0.9916, showing a fairly even split between buyers and sellers market-wide.
Looking closer at individual exchanges, more traders are holding long positions than short ones. On Binance, the SOL/USDT long/short account ratio sits at 1.5786. On OKX, it is 1.46.
Top traders on Binance lean even further toward longs, with a ratio of 1.8711 by account and 2.3737 by position size.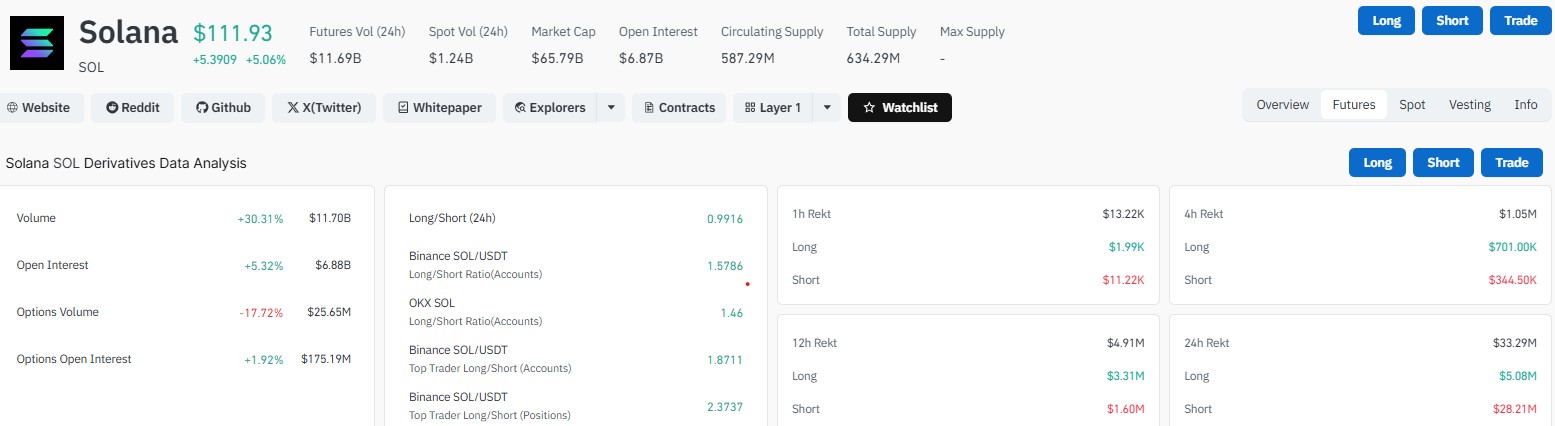
How Much SOL Was Liquidated in 24 Hours?
Total liquidations reached about $33.29 million in the past day. Short sellers took the bigger hit.
Time Frame
Long Liquidations
Short Liquidations
1 Hour
$1.99K
$11.22K
4 Hours
$701.00K
$344.50K
12 Hours
$3.31M
$1.60M
24 Hours
$5.08M
$28.21M
Short liquidations made up the largest share of the 24-hour total. This usually happens when a fast price jump forces short sellers to close losing bets, which can push price up even more.
Solana Price Prediction: Can SOL Hit $155?
On the chart, price advanced from roughly $75 to $112 in a strong impulse move, before consolidating in a pattern that resembles a bullish flag rather than a market top.
Price has since breached the bullish flag, a development chart analysts regard as the key technical signal on the chart right now.
The moving-average structure supports that reading. The 20-day exponential moving average sits near $101.95, the 50-day near $94.60, the 100-day near $89.13, and the 200-day near $92.44.
At $111.63, price trades above all four, with the shorter-term averages positioned above the longer-term ones, a configuration consistent with an uptrend.
The measured move on the chart is particularly notable. The initial impulse is approximately $36, running from around $75 to $111, and projecting that same distance from the breakout point yields a target near $155.
In other words, if the breakout holds, the chart's own measured-move methodology points toward $155.
Under that scenario, the path higher would likely run through intermediate levels near $115, $125, $135, and $145 before reaching $155.
Chart watchers are focused on the $105-to-$108 zone as a key retest area; a hold above that range would reinforce the bullish case. The 20-day moving average, near $101.95, offers a secondary layer of support.
A break back below the breakout zone, accompanied by a loss of the 20-day average, would undermine the bullish setup and could put the $94-to-$95 region, near the 50-day average, back in focus.
Analysts caution that $155 represents a pattern-derived target rather than a forecast with any guarantee, and market conditions can shift the outlook at any time.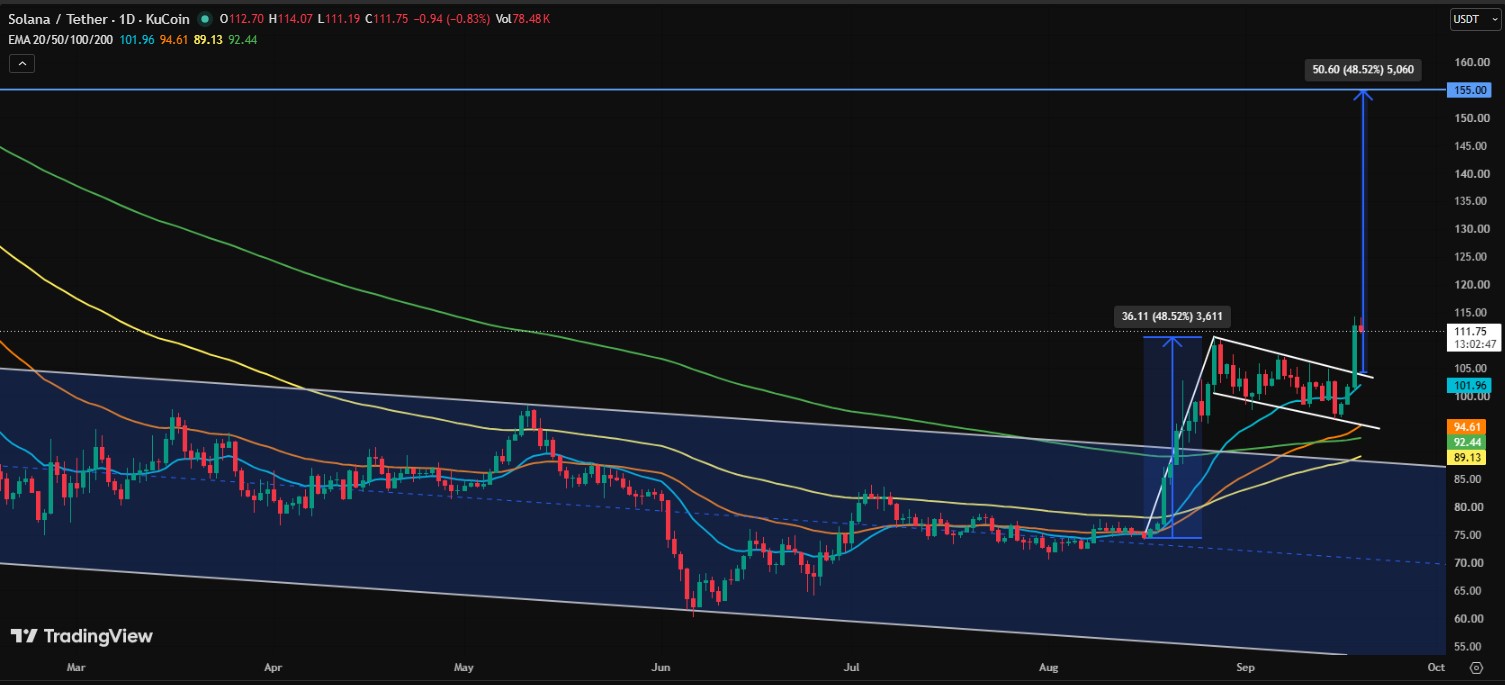
Key Takeaways From This SOL Price Forecast
Price action today shows real strength, backed by rising volume, growing open interest, and fresh ETF inflows. The broader altcoin rally and softer regulatory news out of Washington are adding fuel.
Still, short-term charts can shift fast. Anyone following this Solana price prediction should watch the $105 to $108 support zone closely over the coming days.
Disclaimer
This article is for informational purposes only and does not constitute financial, investment, or trading advice. Cryptocurrency markets are highly volatile and unpredictable. Prices can rise or fall sharply within short periods. Always conduct your own research before making any investment decisions.