SpaceX is back in focus after a big spectrum deal. The stock closed at $162.57 on Friday, up 1.25%, on Nasdaq. Traders now weigh fresh telecom news against a chart that still needs confirmati
SpaceX is back in focus after a big spectrum deal. The stock closed at $162.57 on Friday, up 1.25%, on Nasdaq. Traders now weigh fresh telecom news against a chart that still needs confirmation.
What Is the SpaceX Share Price Today?
The stock opened at $165.34 on Friday and hit a high of $166.38. It slid toward the $160.61 low, then buyers stepped back in late in the session.
The stock closed at $162.57, up $2.00 from the $160.57 prior close. After hours, the $SPCX stock price was $162.76.
Metric
Value
Close
$162.57 (+1.25%)
After-hours price
$162.76 (+0.12%)
Previous close
$160.57
Open
$165.34
Day's range
$160.61 to $166.38
Bid / Ask
$160.03 x 600 / $163.97 x 600
52-week range
$104.83 to $225.64
Market cap
$2.143 trillion
Volume / Avg. volume
92,493,813 / 93,721,233
EPS (TTM)
-1.10
Next earnings (est.)
November 3, 2026
1-year target estimate
$224.78
Volume was about 1.31% below average, so the move had normal activity behind it. Beta, P/E, and dividend data are blank, and the forward dividend is 0.00%.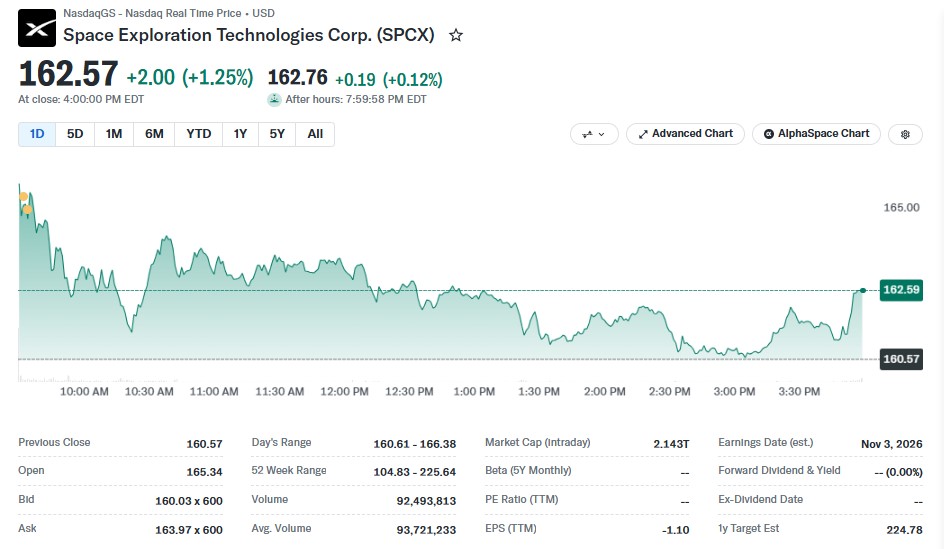
Latest SpaceX Stock News: Why Is SPCX Moving Today?
The company agreed to buy up to 14 megahertz of paired spectrum in the 800 MHz band from Grain Management LLC, a digital infrastructure investment firm. The price was not shared, and the deal needs FCC approval.
After approval, it plans to link its Starlink satellite-to-mobile network with a land-based network. Low-band spectrum passes through walls and buildings, which helps with dead zones.
Elon Musk wrote on X that this is the final key piece for full phone coverage in America. Shares of mobile carriers fell on Friday after the news.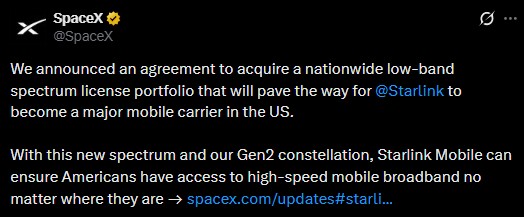
SPCX Stock Price Prediction: What Do the Charts Say?
On the 8-hour chart, the share trades near $161.84, down 0.97%. Price moved above the $160 area, which may signal a bullish continuation.
An Elliott Wave count marks wave 1 near the recent peak and wave 2 as the pullback. The chart also shows price sitting above a cloud, with the $148.74 line below.
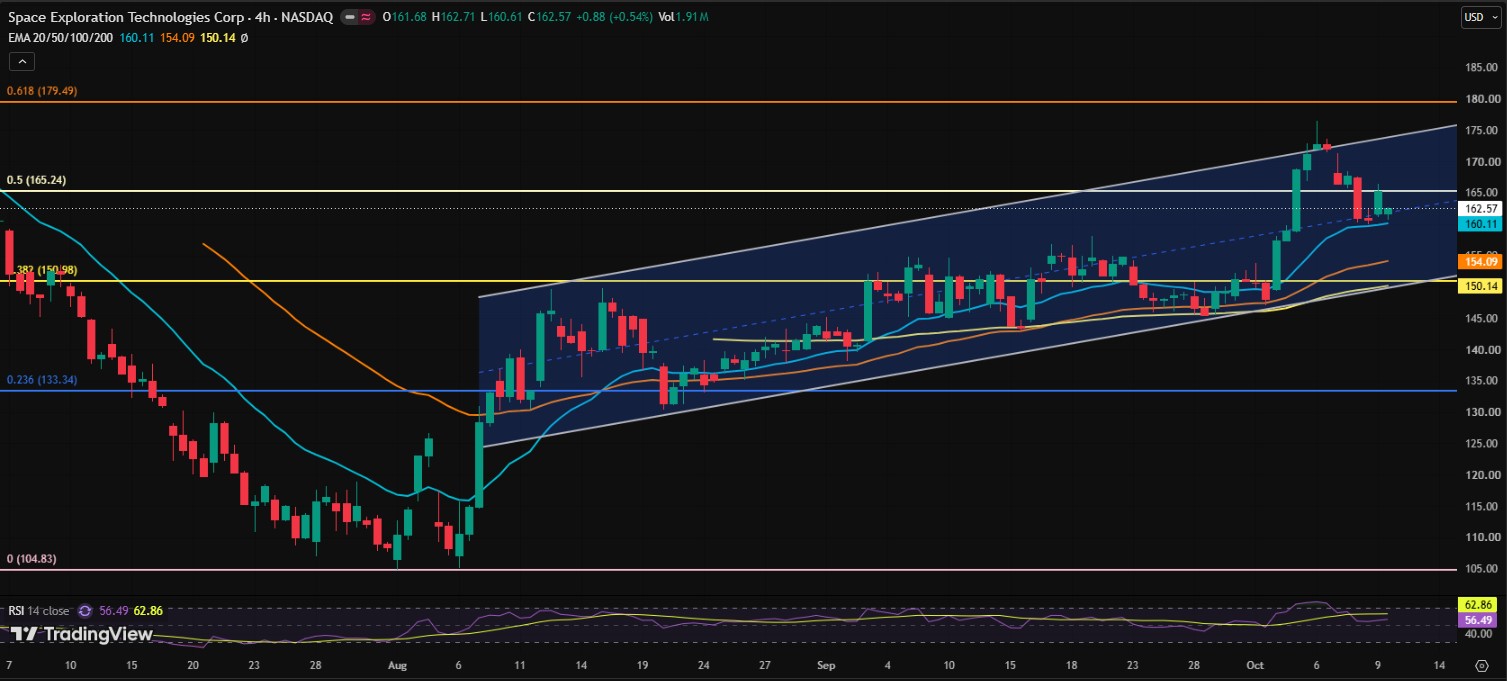
The weekly chart is less friendly. Price fell back inside the 2-month channel after a rejection at the 0.618 log Fibonacci level. That left a long upper wick and a shooting star shape, which is not a bullish candle.
It is a very young chart, so patterns are hard to trust. Confirmation matters.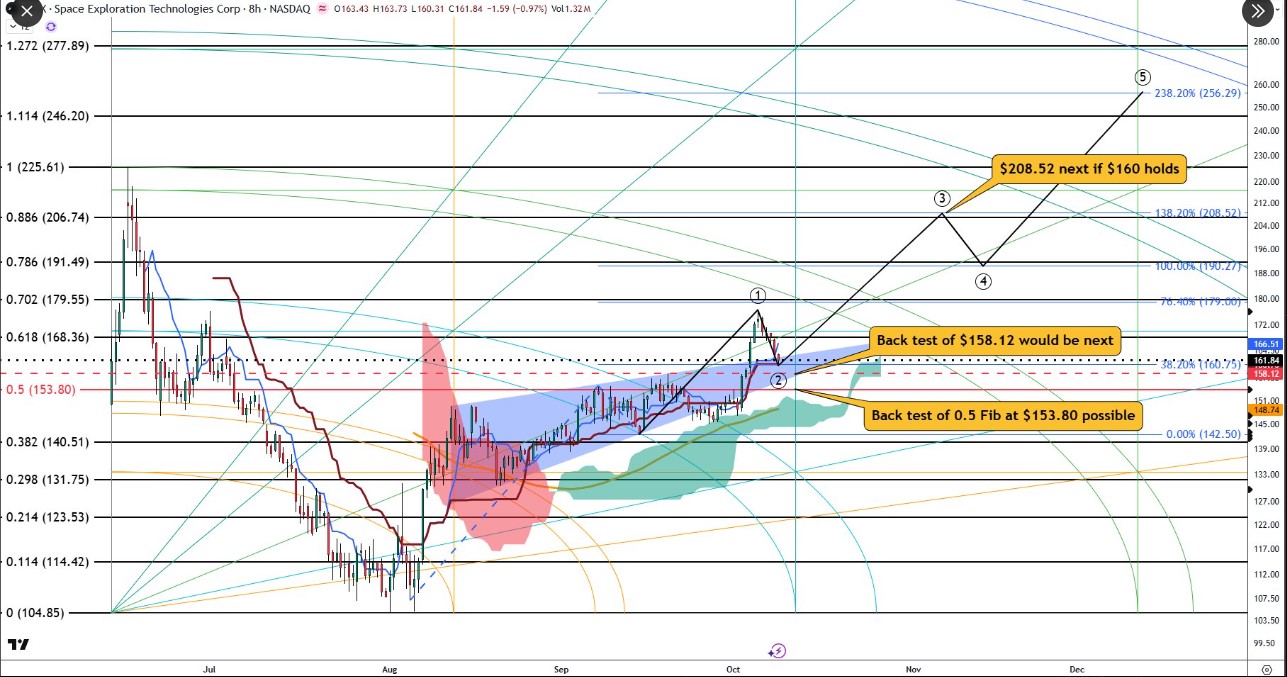
What Is the Support Level for SPCX Stock?
Level
Price
Note
Low point
$104.85
Chart base
Deep support
$140.51 / $142.50
0.382 Fib / 0.00% extension
Cloud line
$148.74
Below current price
Major support
$153.80
0.5 Fibonacci level
Support
$158.12
Possible backtest
Pivot
$160.75
38.2% Fibonacci level
Resistance
$168.36 / $179.55
0.618 / 0.702 Fib
Targets
$179, $190.27, $208.52
78.4%, 100%, 138.2% extensions
Long-term target
$256.29
238.2% extension
Is SpaceX Stock a Buy? SPCX Forecast Explained
The bullish case needs the $153.80 to $158.12 zone to hold. The chart note says $208.52 is next if $160 holds. Its wave path goes to $179, dips toward $190.27, then aims at $256.29.
The bearish case is simpler. A sustained break below $153.80 would weaken the setup. One analyst said losing that level could get rough for bulls.
Overall, this SPCX stock forecast leans cautiously bullish while support holds. Nothing is certain.
Is There an Analyst Target for SPCX Stock?
The 1-year target estimate is $224.78, about 38% above the $162.57 close. The 52-week high is $225.64.
The stock sits about 28% below that high and 55% above the $104.83 low. EPS is negative at -1.10. The November 3, 2026 earnings date may bring a big move either way.
Will SPCX Stock Go Up or Down Next?
The spectrum deal gave a short-term lift and hit carrier shares. But the weekly rejection near the 0.618 level is a warning sign.
Watch $158.12 and $153.80 first. Then watch $168.36 for any breakout attempt. Keep an eye on the SPCX price after the FCC decision.
Disclaimer
This article is for information only and is not financial advice. Stock prices can swing fast, and you can lose money. Price targets and chart patterns are not guarantees. Do your own research and speak with a licensed financial advisor before you invest.