SPX6900 price prediction2040 searches have been picking up as $SPX trades near $0.38, sitting inside an ascending channel that's been forming on the monthly chart since late 2025. That's not
SPX6900 price prediction2040 searches have been picking up as $SPX trades near $0.38, sitting inside an ascending channel that's been forming on the monthly chart since late 2025.
That's not nothing for a token that spent most of this year grinding sideways after a sharp drop from its highs.
There's no roadmap or product update driving this conversation.
$SPX6900 is a pure meme-market token built around a satirical "stock market" narrative, so any long-range prediction here leans almost entirely on chart structure and whether the community around it keeps showing up.
Where $SPX Is Trading Right Now
SPX6900 is currently sitting around $0.38363, up about 13.41% this month, after opening at $0.33827 and touching a high of $0.43230.
That's a meaningful bounce off the monthly low of $0.32946, and it's happening inside the same ascending channel that's been holding since the coin's last major low.
Volume has picked up alongside the bounce, which is usually the first thing chart watchers look for before treating a move like this as more than noise.
The Monthly Chart: Ascending Channel Setup
The main structure on this chart is the ascending channel running from the late-2025 lows up through the current price zone.
Price has bounced between the upper and lower rails of that channel a few times already, and the current candle is testing the upper boundary again. 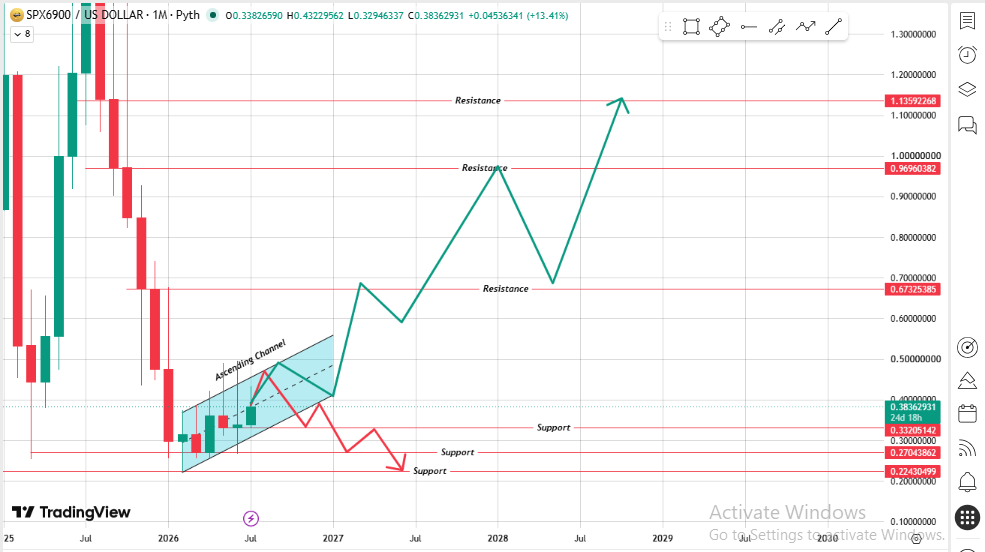
Source: Chart Taken By TradingView
$SPX6900 Key Support and Resistance LevelsLevel TypePriceWhat It MeansDeep Support$0.22430Extreme downside floor if the channel fails.Mid Support$0.27044Secondary floor below the current base.Channel Support$0.33205Lower boundary of the current price structure.Current Price$0.38363Testing the upper channel rail.First Resistance$0.67325Initial ceiling above the channel.Second Resistance$0.96960Level just below the psychological $1 mark.Third Resistance$1.13592Level that would confirm a stronger trend shift.
For SPX6900 to clear its nearest major resistance, price needs to almost double from here, a reminder of how much room sits between the current range and the levels that would actually confirm a longer-term move.
Losing the $0.33205–$0.27044 zone would point toward a retest of the deeper $0.22430 floor rather than the recovery path laid out below.
How SPX6900 Compares to Other Meme Tokens
It's worth putting SPX6900 next to other large-cap meme coins rather than looking at it in isolation, since that's the peer group it actually competes with for liquidity and attention.
SPX6900 vs Large-Cap Meme Coins Comparison
FactorSPX6900Typical Large-Cap Meme CoinChain PresenceMultichain (ETH, Solana, Base)Often single-chain at launchNarrative"Beats the S&P 500" satireUsually an animal/internet mascot themeDrawdown From ATH~83% off $2.27 highCommonly 80–95% off cycle highsExchange AccessBybit, Kraken, Coinbase, Binance and othersVaries widely by projectFormal DocumentationNo public whitepaperAlso uncommon in this category
SPX6900's drawdown and lack of formal documentation aren't unusual for this asset class.
The real differentiator is the "flip the market" narrative, which has kept it culturally distinct from a crowded field of animal-themed tokens, and the multichain presence.
Which gives it slightly broader liquidity access than many single-chain meme tokens get at a similar market cap.
What Could Actually Move the Needle Through 2040
No formal utility, and that's the point. SPX6900 Price Prediction 2040 was built as a meme project poking fun at traditional markets.
There's no staking, no product, and no roadmap in the traditional sense; its value case is almost entirely about community size and cultural relevance.
Exchange growth. More listings and deeper liquidity tend to matter more for coins like this than any technical development, simply because it widens the pool of people who can actually buy in.
Broader meme-coin cycles. SPX6900 doesn't have an independent demand driver, so its long-term path will likely track overall risk appetite and meme-coin rotation more than anything specific to the project.
Community durability. Coins in this category tend to live or die by whether their community sticks around through the quiet stretches.
SPX6900 has already been through one full boom-and-bust cycle and is still trading with real volume, which says something.
SPX6900 Price Prediction 2027–2040YearTarget RangeWhat It Would Take2027$0.45 – $0.60Price clears the upper channel rail and holds above $0.45 on a monthly close.2029$0.60 – $0.80Momentum carries through the first resistance near $0.67325.2031$0.80 – $0.97Price moves toward the second resistance near $0.96960.2035$0.97 – $1.14SPX6900 breaks the second resistance and tests $1.13592.2040$1.14 – $1.50Full breakout above key resistance levels during a strong meme-coin cycle.
If SPX6900 manages to hold above $1.50 for a stretch rather than just tagging it and falling back, that's usually the point where a token stops looking like a recovery play and starts looking like the early stage of a fresh cycle.
Pair that with a genuine meme-coin mania phase somewhere over the next decade, and a push toward $5 by 2040 isn't unreasonable, though it would need real, sustained buying behind it rather than a single spike
This is a ladder of chart levels, not a calendar of guarantees. Meme tokens can tear through several of these zones in a matter of weeks.
During a mania phase, spending years stuck below the base SPX6900's own history, from under $0.08 to a $2.27 peak and back down again in about a year, is a good example of how fast that can move in either direction.
Bear Case, Base Case, Bull Case
Bear case: SPX6900 loses the $0.33205 channel support, slides toward $0.27044 and eventually $0.22430, and liquidity thins out as attention shifts to newer meme tokens with more active narratives.
Base case: The channel holds. SPX6900 keeps bouncing between its rails, slowly grinds through $0.67325 and $0.96960 over several years, and settles somewhere in the $0.80–$1.00 range by the early 2030s as the broader meme-coin sector matures around it.
Bull case: A strong crypto-wide bull cycle combines with renewed meme-coin mania to push SPX6900 through all three resistances, landing somewhere in the $1.14–$1.50 zone by 2040.
Treat these three ranges as boundaries for thinking about the setup, not fixed outcomes; the actual path will depend a lot on how the broader market behaves over the next decade and a half.
Putting It Together
The case behind this SPX6900 price prediction 2040 comes down to three things.
First, the technical setup: Price is sitting inside an ascending channel with a fairly clear ladder of resistance levels mapping out what a longer recovery would look like if momentum holds.
Second, there's no independent catalyst here. SPX6900 doesn't have a product or roadmap driving demand.
So anything that happens over the next decade will be shaped almost entirely by community size and broader crypto cycles rather than project-specific news.
Third, channels break in both directions. A support break here would look just as significant as a resistance break to the upside, so the base of this range matters just as much as the ceiling.
Bottom Line
SPX6900 is testing the upper rail of an ascending channel that's been held for months, with a stack of resistance levels above it that would need to be cleared one at a time for the more optimistic 2040 targets to become realistic.
None of that guarantees anything; meme tokens can lose relevance just as quickly as they gain it, and the same chart structure that points toward $1.14+ by 2040 could just as easily fail and send the price back toward the deeper support zone instead.
The $0.33205 support is really the level worth watching here.
Hold it, and the setup stays intact. Lose it, and this whole recovery story needs a rewrite.
Disclaimer: This article is for informational and educational purposes only and should not be considered financial or investment advice. Cryptocurrency markets are highly volatile, and price predictions are speculative by nature. Always conduct your own research and consult a qualified financial advisor before making any investment decisions.