Stellar has quietly turned into one of the more interesting charts on the board, and the Stellar price prediction conversation is picking up as $XLM pushes higher for a second straight week.
Stellar has quietly turned into one of the more interesting charts on the board, and the Stellar price prediction conversation is picking up as $XLM pushes higher for a second straight week.
This XLM price analysis lands right as the token breaks out of a downtrend that has weighed on it for months, and the timing lines up with news that could change how the market values the network.
Whether this is the start of something bigger is what the chart is about to answer.
How Strong Is XLM Price Today?
Per CoinGlass, $XLM trades near $0.21907, up 7.77% on the day, with a market cap of $7.69B built on 34.94B tokens circulating out of a 50.00B total and maximum supply.
With roughly 70% of supply already in circulation, the fully diluted value sits close to $10.95B, a tighter gap than most large-cap tokens and a useful anchor for any Stellar price prediction today.
Why Is XLM Price Up Today?
BSCN reported fresh signs of Stellar network growth: the chain is now #3 for Stellar RWA tokenisation, also described as tokenised real-world assets, hosting a reported $2.75 billion in tokenised RWAs per DefiLlama data, behind only Ethereum and BNB Chain and ahead of Solana, Avalanche, and Aptos.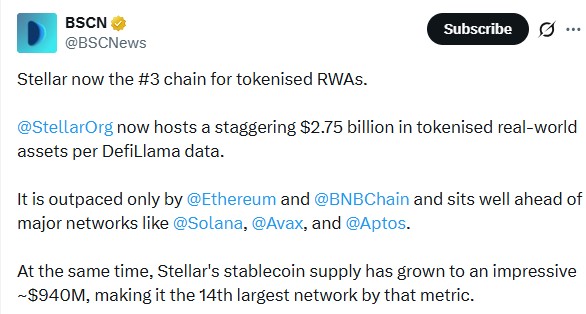
Alongside that, Stellar's stablecoin supply growth has pushed the network's stablecoin base to roughly $940M, making it the 14th largest network by that metric.
That combination of real-world-asset traction and stablecoin growth is feeding directly into why is $XLM price rising today, rather than the move being pure momentum.
CoinGlass Performance data shows $XLM down 0.48% over four hours but up 7.48% over 24 hours and 18.84% over the past week, extending to 19.57% over 30 days, 22.86% over 90 days, and 29.90% over 180 days; year-to-date gains sit at 8.67%, though the token remains down 41.89% across the past year despite an outsized all-time gain.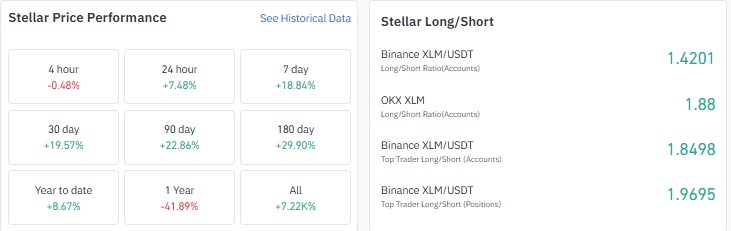
Positioning across Stellar derivatives traders leans long: the Binance XLM/USDT long/short ratio reads 1.4201.
OKX sits higher at 1.88, and top traders on Binance run hotter still at 1.8498 by accounts and 1.9695 by positions, a sign confidence in the move runs deeper than casual retail positioning.
Where Is XLM Trading Activity and Liquidation Pressure Concentrated?
Binance leads $XLM's futures volume heatmap at $170.28M, followed by Bybit at $61.74M, WhiteBIT at $54.16M, and OKX at $43.57M.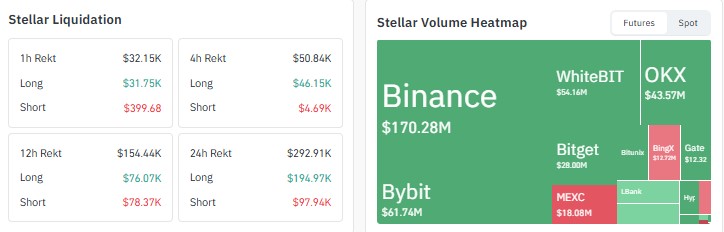
Bitget at $28.00M and MEXC at $18.08M, showing liquidity is heavily concentrated on a handful of venues.
Liquidations over 24 hours totalled $292.91K, and unusually for a day this strong, longs took the bigger hit at $194.97K against $97.94K in shorts, pointing to some sharp intraday volatility even as the broader trend stayed up.
Is Rising XLM Open Interest Confirming the Rally?
XLM open interest data from CoinGlass shows the figure climbing to $279.55M, up from $261.59M earlier in the same session on 25 September.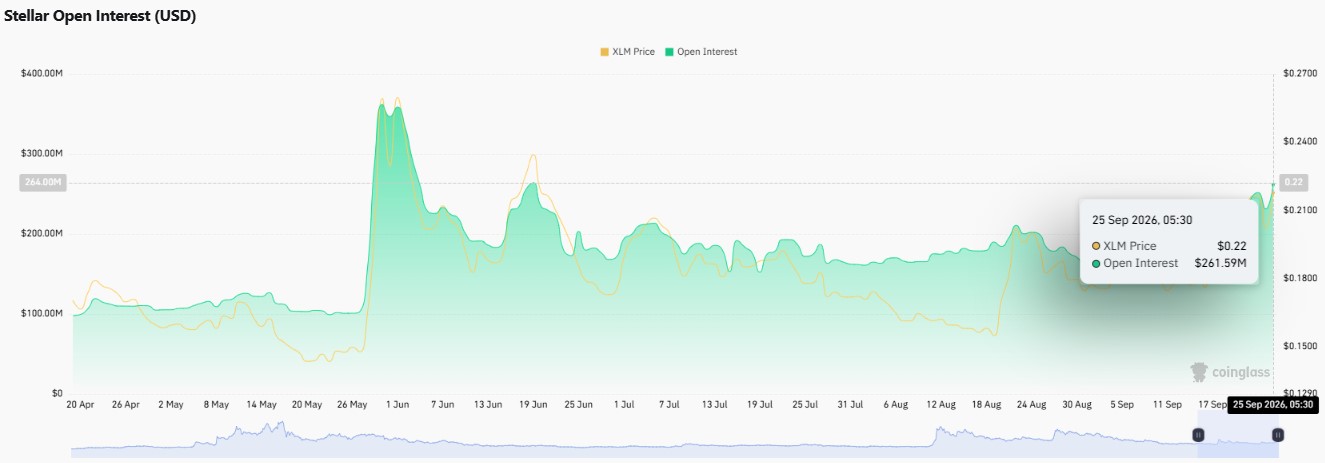
XLM futures volume of $438.30M runs well ahead of spot volume of $168.61M, so leverage is playing a meaningful role in the move.
Open interest and price rising together generally point to fresh positioning building up rather than short covering alone.
XLM Daily Chart: Is Stellar Breaking Out of Its Downtrend?
This Stellar price chart gives the clearest read on where momentum stands.
Per TradingView chart data, $XLM spent June through August sliding inside a descending channel before breaking above it in early September, and price has since been consolidating in a tight range around $0.216 to $0.218 before this week's push higher.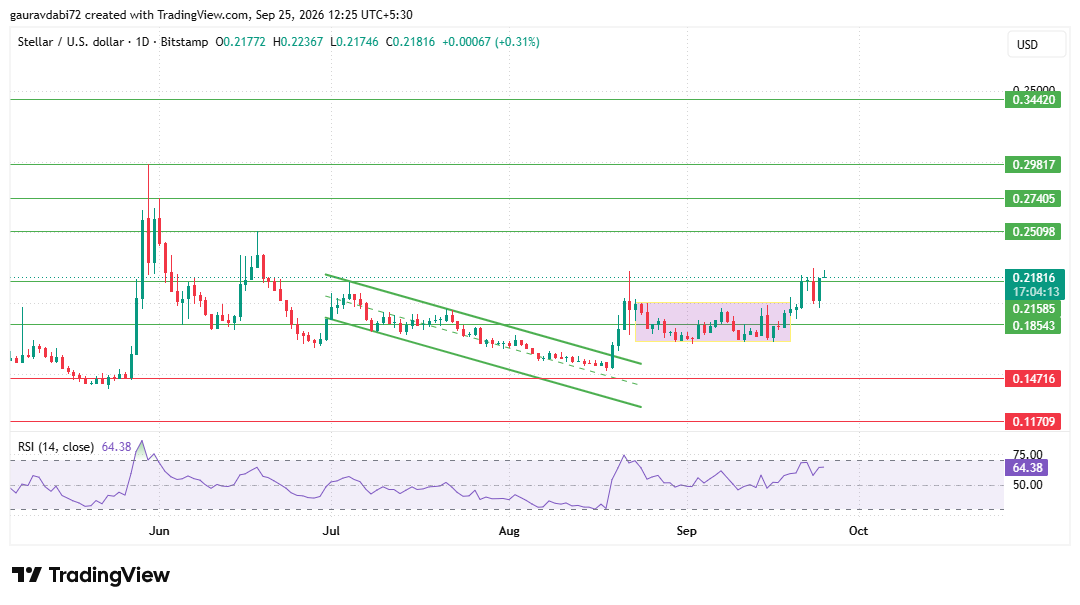
This XLM technical analysis puts resistance at $0.25098, then $0.27405, $0.29817, $0.34420, and $0.35000, while support runs through $0.18543, $0.14716 and $0.11709.
The XLM RSI reads 64.38 on the daily chart, elevated but still short of overbought, leaving some room for the move to extend before momentum gets stretched.
Stellar Price Prediction: Key Levels to Watch Next
Scenario
Trigger
Key Levels
Bullish
Firm acceptance above $0.21816
$0.25098, then $0.27405 and $0.29817
Neutral
Range-bound without a breakdown
Between $0.21816 and $0.18543
Bearish
Close below $0.18543
$0.14716, then $0.11709
What Could Derail the Stellar Rally?
A few things could cap this move. The heavier long-side liquidations over the past 24 hours show the rally isn't a one-way street, and a rejection at range resistance could trigger a similar squeeze.
Futures volume running well above spot volume means leverage-driven swings remain a risk in either direction.
And with $XLM still down sharply over the past year, broader market sentiment could turn quickly if the tokenisation narrative cools.
What Does the Analyst Desk Think About XLM?
As per the CoinGabbar analyst desk, this move stands out because it is underpinned by genuine growth in Stellar's tokenisation ecosystem and payments network rather than pure speculation, which gives it more credibility than a typical altcoin spike.
That said, a multi-month downtrend needs more than a single breakout week to be considered fully reversed, so follow-through over the coming sessions matters more than the initial move.
Conclusion
The Stellar price prediction for the days ahead hinges on how price behaves around $0.21816. Holding above it keeps the breakout intact and opens the path toward $0.25098 and $0.27405, while a slip back below $0.18543 would put the move on pause.
Strong volume, a genuine RWA-driven catalyst, and rising open interest support the case for further upside, but leverage-heavy positioning argues for some caution near current levels.
Disclaimer: This article is for informational purposes only and is not financial advice. Cryptocurrency prices are highly volatile, so readers should do their own analysis and consult a qualified advisor before making any investment decision.