SUI broke its multi-month descending structure and reclaimed $1, with $1.42 identified as a key trend-change level. SUI trades above its 50-day and 200-day moving averages as September volume
- SUI broke its multi-month descending structure and reclaimed $1, with $1.42 identified as a key trend-change level.
- SUI trades above its 50-day and 200-day moving averages as September volume expands alongside the price breakout.
- A weekly close above $1.42 could open targets at $2.65, $5.36, $10 and $20, while $1.01 offers nearby support.
SUI has climbed fast from its September low near 0.68-0.70, trading around $1.273 after breaking its multi-month structure. Analysts Crypto Patel and Ali Charts identified $1.42 as an important level, while the chart shows rising volume and price above key moving averages. SUI also moved above $1 and its previous August high.
https://twitter.com/alicharts/status/2103792514654204290?s=20
SUI Reclaims Key Levels
Crypto Patel said SUI broke its multi-month descending structure and reclaimed its key trendline. The analyst identified $0.87 as the confirmed channel breakout level. However, Patel placed greater focus on $1.42 as the higher-timeframe trend-change level.
A weekly close above $1.42 would invalidate the bearish structure, according to Patel. Patel listed $2.65, $5.36, $10 and $20 as upside targets. If SUI/USDT fails below $1.42, Patel said the price could retest the 0.84-0.70 accumulation zone.
Ali Charts said SUI bounced from the channel bottom after three macro buy signals appeared on its weekly chart. The analyst also noted that SUI reclaimed the mid-range near $1.
Volume Expands During September Rally
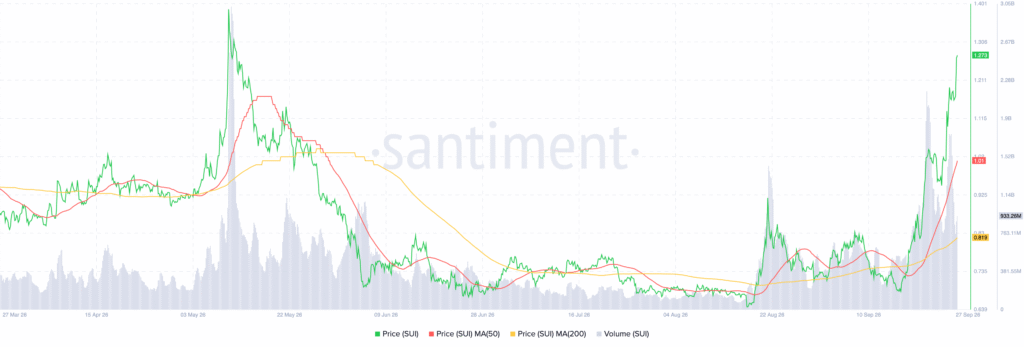
The chart shows SUI rising sharply during September after several months of broad consolidation. The September low remained near 0.68-0.70, while price reached about $1.273. SUI also moved above the August high around 0.92-0.95 and crossed the $1 level.
Meanwhile, the 50-day moving average is near $1.01. The 200-day moving average stands near $0.819, leaving SUI above both averages. The 50-day average has also turned upward after spending much of summer below or near the 200-day average.
Source:
Santiment
Trading volume reached about 933.26 million SUI during the latest advance. The increase came with the breakout and followed quieter activity during July and early August.
$1.40 Remains the Next Chart Barrier
On the upside, $1.30 represents the immediate psychological level, followed by the chart high around $1.401. A sustained move above $1.40 would open higher price levels on the chart.
However, rejection between $1.30 and $1.40 could send SUI toward $1.01. The 0.92-0.95 area provides another support zone. The chart places $1.30, $1.40 and Patel's $1.42 level above the current price.