$Sui built its whole pitch around speed and cheap fees for everyday apps, games, and payments, rather than trying to be a jack-of-all-trades smart contract chain like Ethereum. That's useful
$Sui built its whole pitch around speed and cheap fees for everyday apps, games, and payments, rather than trying to be a jack-of-all-trades smart contract chain like Ethereum.
That's useful background, but this sui price prediction August 2026 is really about what's happening on the chart today.
$SUI is sitting at $0.69, up 1.0%, stuck in a quiet sideways box on the daily timeframe while a much bigger story plays out underneath it on the weekly chart.
Sui Price Today: Live Data and 24-Hour Change (Prediction)
$SUI trades at $0.69 right now, up 1.0% on the day, after swinging through a 24-hour range of $0.6752 to $0.696.
Market cap is $2.796B, outstanding token value is $3.108B, and fully diluted valuation jumps all the way to $6.901B. 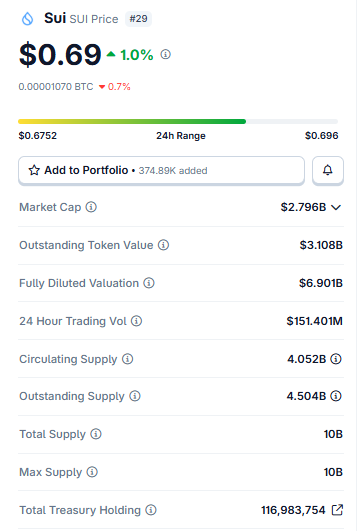
Source: $SUI Market Cap Data Taken From Coingecko, data as of July 29, 2026. Figures may vary slightly across other tracking websites.
That's a big gap, and it's worth remembering as we go, since it points to a lot of supply still waiting in the wings. Trading volume over the past 24 hours came in at $151.401M.
Circulating supply is 4.052B SUI, outstanding supply is 4.504B, and both total and max supply sit at 10B. So less than half of everything SUI will ever put into circulation is out there today.
On top of that, the project's own treasury is sitting on 116,983,754 $SUI.
Technical Analysis: Key Support and Resistance Levels ($SUI Price Prediction)
$SUI Daily Chart Analysis
The daily chart has $SUI currently inside a sideways box for a while now, bouncing between roughly $0.69 and the mid-$0.70s without going anywhere in particular. 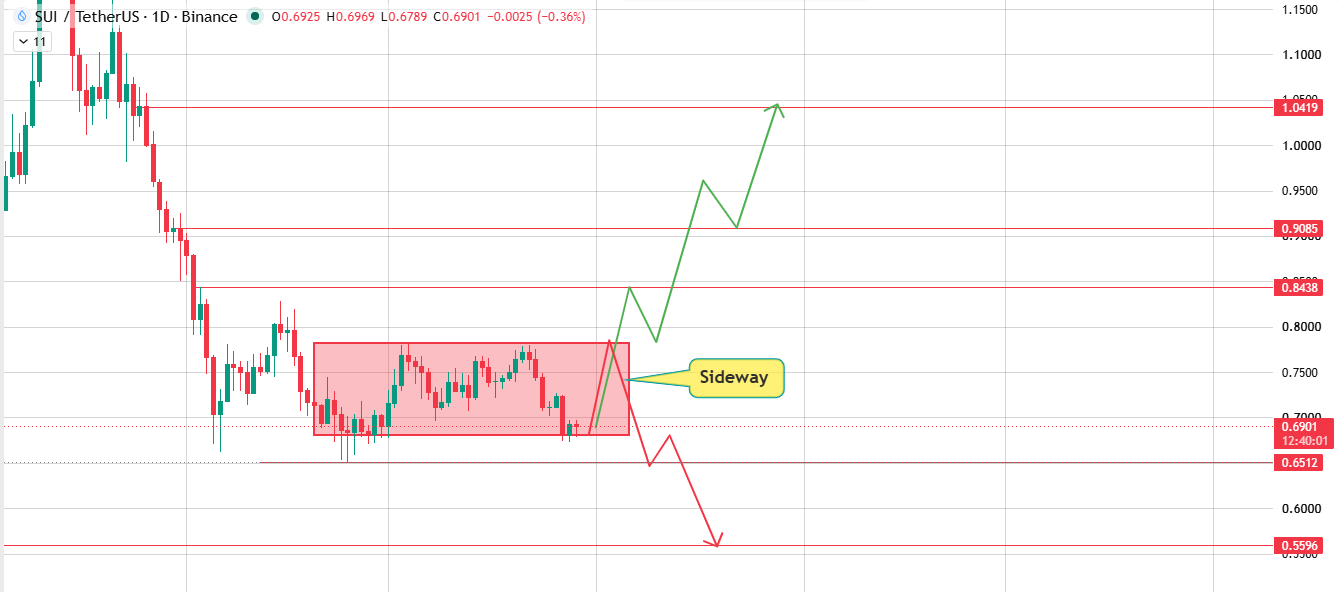
Source: Chart Taken From TradingView.
Get a volume-backed breakout above that box, and resistance stacks up at $0.8438, then $0.9085, then $1.0419.
But if that breakout can't hold, or the volume just never shows up, price is far more likely to slip back toward $0.6512 and possibly $0.5596 below that.
Weekly Chart Analysis for Sui Price Prediction August 2026
Zoom out to the weekly chart, though, and it's a different animal entirely.
$SUI has spent months sliding down inside a descending channel, and the price is now sitting right on the channel's lower boundary, more or less on top of its own support zone.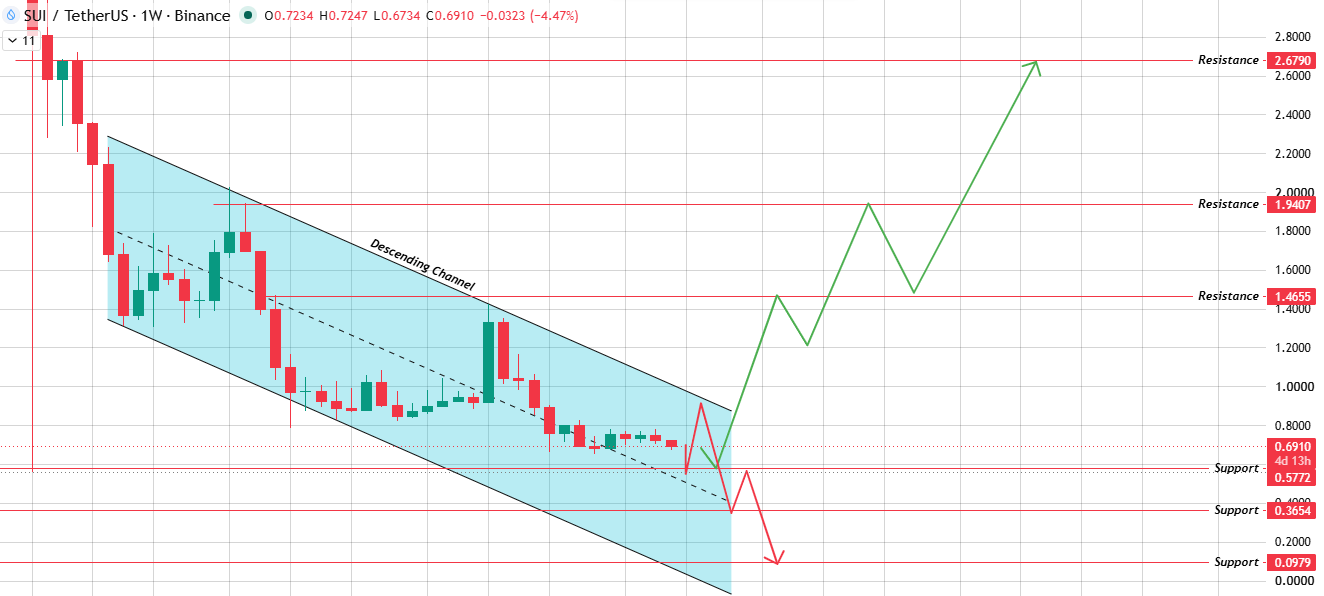 Source: Chart Taken From TradingView.
Bounce here and clear breakout the upper boundary of that channel, and the targets get a lot bigger: $1.4655 first, then $1.9407, with $2.6790 as a genuine long-term stretch goal.
Fail to hold that bounce instead, and this could get ugly fast, dropping toward $0.5772, then $0.3654, and $0.0979 in the worst case.
Sui Price Prediction for August 2026: Bull, Base, and Bear Cases (Monthly)
Strip this Sui price prediction August 2026 down to its core question: can SUI actually break out of the sideways box it's been trapped in on the daily chart?
With real volume behind it, while a much larger descending channel on the weekly chart still looms overhead?
ScenarioAugust 2026 TargetInvalidation LevelBull$0.8438 – $0.9085Rejection at the box/channel boundary or daily close below
$0.6512Base$0.6512 – $0.8438 (Range-Bound)Confirmed close outside either boundaryBear$0.6512 – $0.5596Break and hold below
$0.6512For the bull case, volume needs to show up and actually push price out of that daily box and then clear the weekly channel's resistance on top of that.
Pull that off, and $0.8438 comes first, then $0.9085, with $1.0419 as a bigger reach if momentum keeps building.
The base case is a lot less exciting: price just keeps drifting inside the box, going nowhere fast.
And the bear case kicks in the second $0.6512 break, since that's a level showing up on both charts, not just one.
On-Chain and Fundamental Drivers ($SUI Price Prediction)
That gap between a $2.796B market cap and a $6.901B fully diluted valuation is really the fundamental story here.
Just over 4B $SUI is circulating out of a 10B ceiling, meaning there's still a lot left to enter the market down the road, and that kind of overhang usually puts a lid on upside compared to coins closer to fully unlocked.
Add in a treasury sitting on close to 117 million SUI, and any large chunk of that moving onto exchanges at the wrong moment is a real, if quiet, risk.
August 2026 Catalysts That Could Move Sui
New apps and games launching on Sui, continued ecosystem growth, and the steady drip of scheduled token unlocks are the main Sui-specific things to watch this August.
Beyond that, though, broader altcoin liquidity and whatever Bitcoin dominance is doing will probably matter just as much, since SUI tends to ride the wider market's mood more than it moves on its own.
What Analysts Are Forecasting (SUI Price Prediction)
Chart readers looking at $SUI right now are basically looking at two different coins depending on which timeframe they pick.
Zoom into the daily chart, and it's quiet, boxed-in consolidation waiting on a volume trigger.
Zoom out to the weekly chart, and it's still a longer downtrend, only just now testing where it might finally stop.
Sentiment leans cautiously positive as long as $0.6512 holds up and turns more careful the moment it doesn't.
None of this is personalized financial advice, just chart-and-data analysis, and crypto stays volatile enough that past patterns are no promise of what comes next.
Sui Long-Term Outlook: 2027 to 2030
Assuming $0.6512 holds through the rest of 2026, and the weekly channel's support zone does what descending-channel bottoms often do, a longer grind up toward $1.4655 and maybe $1.9407 seems reasonable across 2027 and 2028.
Where $SUI actually lands by 2030 probably has less to do with any single level on this chart and more to do with how much of that remaining token supply gets soaked up by genuine demand over time.
Risks That Could Invalidate This Forecast
The main risk here is straightforward: a confirmed break below $0.6512, the one support level both the daily and weekly charts agree on.
That opens a path toward $0.5596 in the near term, and the weekly chart's much deeper levels near $0.3654 and $0.0979 if things really unravel.
On the flip side, a genuine volume-backed breakout from that daily consolidation box could send SUI through resistance faster than the bull case above assumes.
How to Buy and Store Sui Safely
SUI is available on most major exchanges, usually paired against USDT, USD, or BTC.
Given how much supply is still set to unlock over time, it's worth keeping an eye on upcoming releases before making any bigger moves.
Hardware wallets are the safer call for long-term holdings, and software wallets work just fine for smaller amounts you're trading more actively.
Disclaimer: This sui price prediction is for informational and educational purposes only and should not be considered financial or investment advice. Cryptocurrency markets are highly volatile, and prices can change rapidly. Always conduct your own research and consult a qualified financial advisor before making any investment decisions.