SUI recovered above $0.80, with analysts watching $0.84-$0.85 as the next major resistance zone. SUI trades above its 50-day and 200-day moving averages, though the 50-day MA remains below th
- SUI recovered above $0.80, with analysts watching $0.84-$0.85 as the next major resistance zone.
- SUI trades above its 50-day and 200-day moving averages, though the 50-day MA remains below the 200-day MA.
- Analysts cite wider wedge and divergence patterns, while $0.754 and $0.731 remain key support levels if SUI pulls back.
SUI has moved back above $0.80 after recovering from its June and July weakness. Analysts are tracking resistance near $0.84 and $0.85. Ali Charts cited a fresh SuperTrend buy signal. CryptoBullet, Michael van de Poppe and Investor Jordan outlined separate technical setups around SUI and $1.
Analysts Track Breakout Levels
Ali Charts said SUI’s SuperTrend flashed a fresh buy signal after the recent pullback. He is watching $0.84. A decisive break above that level could support a move toward $1. Investor Jordan also identified $0.85 as the final resistance level.
https://twitter.com/InvestorJordan/status/2100974998080909436?s=20
He said a daily close above it would support a move toward $1. However, the chart places SUI near $0.814, below the $0.83-$0.90 resistance zone. A break above $0.90 could expose the $1.00-$1.02 region.
SUI Recovers Above Key Averages
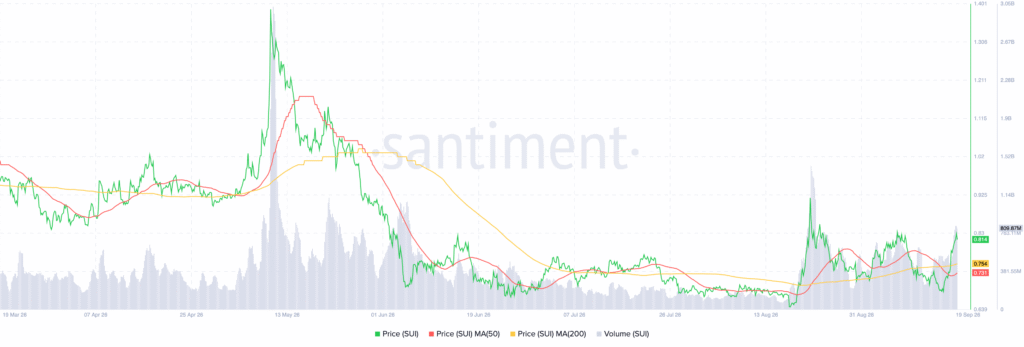
SUI fell from above $1.30 in May to about $0.64-$0.65. It then entered a broad accumulation and consolidation phase. From the August low near $0.64, SUI climbed toward $0.90 before pulling back.
Source:
Santiment
The latest recovery has lifted prices above both major moving averages. The 50-day MA is at $0.731, while the 200-day MA is at $0.754. Notably, the 50-day MA remains below the 200-day MA.
Therefore, the longer-term moving-average structure has not fully shifted into a confirmed bullish setup. Volume also increased during the latest advance. The chart shows about 809.87 million in volume against a reference level near 763.11 million.
Analysts Point to Wider Technical Patterns
CryptoBullet said SUI has formed a large wedge since January 2025. He compared it with a smaller 2023 falling wedge. That earlier pattern preceded a 1,400% rally and nearly reached the 1.618 Fibonacci level.
CryptoBullet said the current 1.618 Fibonacci level is at $20. His stated top target for 2027-2029 remains $20. Meanwhile, Michael van de Poppe said SUI shows bullish divergence across multiple timeframes.
https://twitter.com/CryptoMichNL/status/2101042324310524325?s=20
He also compared the setup with signals he observed before ARB broke out. On the downside, $0.754 marks support near the 200-day MA. The next support is at $0.731, around the 50-day MA. Losing both averages could expose the $0.65-$0.70 area.