Super Inu (SI) is trading near $0.0216, up more than 120% in 24 hours, after launching just days ago on the Robinhood Chain ecosystem, and this Super Inu price prediction breaks down what tha
Super Inu (SI) is trading near $0.0216, up more than 120% in 24 hours, after launching just days ago on the Robinhood Chain ecosystem, and this Super Inu price prediction breaks down what that move actually means.
The token, identified on-chain by the contract address 0xe0cd4e72769e7317891d1e49905878b7b14c67ac, has pulled in a wave of attention following a CoinGecko listing and a viral Trump-themed marketing push. 
This Super Inu price prediction looks at whether the move has legs, and the data tells a mixed story worth unpacking before checking the latestprice prediction coverage.
Quick Super Inu Price Prediction
Metric
Current Outlook
Current Price
$0.0216
24H Change
+120.2%
24H Volume
$9.601M
Trend
Short-term bullish, high risk
Marked Chart Extension
$0.04365 (1.0 Fib level)
Support
$0.00627 (24h low)
Resistance
$0.02489 (all-time high)
RSI (14)
64.21
MACD
Positive MACD above signal
7-Day Outlook
Volatile, dependent on volume follow-through
1-Month Outlook
Wide range, whale-dependent
What Is Driving Super Inu Price Right Now?
The rally traces back to a coordinated launch. Marketing tied the token's name to a widely shared Trump post about "Superior Intelligence,"
and the project's account pushed that angle hard on X.
The AI-branding angle isn't unique to this token. Similar naming plays show up often in recentAI-linked crypto coverage, where marketing borrows AI buzzwords to draw eyes fast.
Trading volume jumped alongside the price. Volume and price both spiked in the first hours of trading, a pattern typical of new liquidity pools rather than organic demand building over weeks.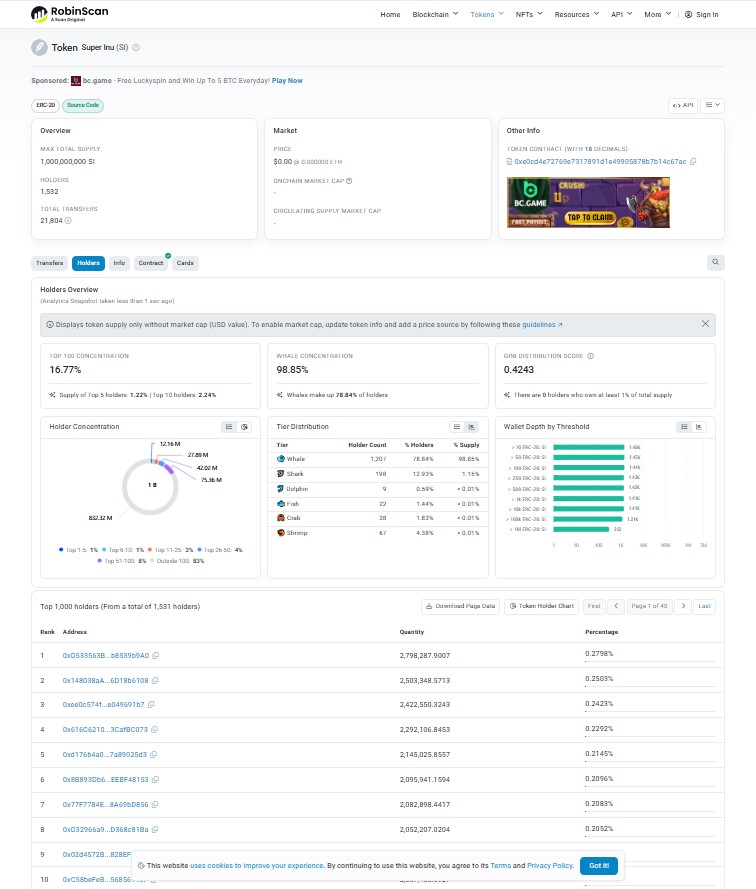
Holder data adds a caution flag here. Whale concentration sits at 98.85%, and the top 100 wallets hold 16.77% of supply, according to on-chain holder tracking.
That's a small number of wallets controlling most of the float. Any exit from those wallets could move the $SI price fast, in either direction.
Sentiment on social channels reads bullish, loud, and promotional. But loud isn't the same as durable.
Projects at this stage often lean on giveaways to widen holder counts fast.
Technical Analysis: What Does the Chart Say About the Next 7 Days?
As per GeckoTerminal, the short-term structure looks constructive on the surface. Price sits above its 100-period EMA, currently near $0.0198, a level often used to gauge short-term trend direction.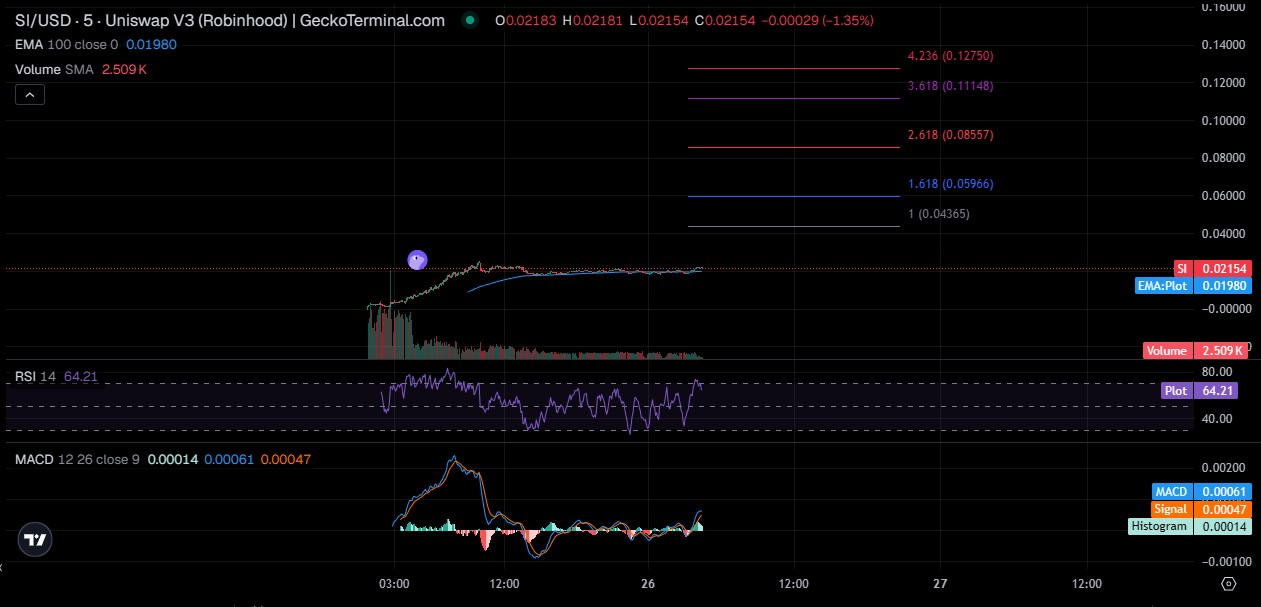
RSI at 64.21 sits in bullish territory but isn't yet overbought. There's room to run before the indicator flashes exhaustion.
MACD shows the MACD line above the signal line, with a shrinking histogram. Momentum is positive but cooling, not accelerating.
Here's the thing: volume has flattened out after the initial launch spike. That flattening matters more than the price chart alone.
A breakout trigger would need renewed volume alongside trading above the recent high near $0.02489. Without volume, any push higher risks fading quickly.
A breakdown trigger shows up if trading slips back under the EMA100 near $0.0198, especially on rising sell volume. That would flip short-term structure bearish fast.
When we pulled up the volume panel next to the RSI, the divergence stood out immediately. Price is calm. Volume already said its piece.
The token's branding leans hard on an AI narrative, and that angle tends to draw fast, fickle attention. BroaderAI-linked crypto news helps separate genuine trend interest from a one-week meme cycle.
Can Super Inu Break the Next Resistance?
The immediate resistance level is the all-time high near $0.02489, set within the token's first day of trading. A sustained move above that level, not just a brief wick, is what confirms a breakout.
Volume confirmation is non-negotiable here. Breaking resistance on thin volume, given how concentrated holdings already are, would be a trap more than a trend.
If trading clears resistance with volume expansion, the next marked level on the chart sits at $0.04365, the 1.0 Fibonacci extension drawn from the launch move. That's not a promise. It's a level, nothing more.
Invalidation comes if trading fails to hold above $0.0198 (the EMA100) after any breakout attempt. That failure would suggest the move lacked real buying support.
Scheduled announcements can also move the timeline up or down. Checking acrypto events calendar is a reasonable habit before assuming any breakout is purely technical.
What Could Happen Over the Next Month?
Three broad paths look plausible for $SI over the coming weeks, and none of them should be treated as guaranteed.
Bullish continuation depends entirely on volume returning and whale wallets staying put. And that's a big "if" given how new this token is.
A base case looks like a sideways chop between the recent low and the all-time high, typical for meme tokens finding a real trading range after launch hype fades.
Bear case risk centers on the same feature that's currently ignored: concentration. If large holders start distributing, support levels won't hold long.
Turns out, the same volatility that created the 120% rally can reverse just as fast. That's the nature of a token barely a few days old.
Comparing this pattern against other recentpresale and IDO launches shows how common this exact boom-then-fade shape actually is.
Bull, Base, and Bear Scenarios
Scenario
Possible Range
Key Driver
Invalidation
Bull
0.02489-0.04365
Breakout with rising volume
Trading falls back under $0.0198
Base
0.00627-0.02489
Range-bound consolidation
Break of either range edge on volume
Bear
Below $0.00627
Whale selling, support breakdown
Reclaim of $0.0198 with volume
Key Levels Traders Should Watch
Support: $0.00627, the 24-hour low.
Resistance: $0.02489, the all-time high.
Breakout trigger: sustained trading above $0.02489 with rising volume.
Breakdown trigger: trading under $0.0198 (EMA100) with rising sell volume.
Invalidation: failure to hold above $0.0198 after any breakout attempt.
Traders also keep an eye on unrelated reward mechanics, like upcomingcrypto airdrops, which sometimes pull short-term liquidity away from small-cap charts like this one.
What Could Move Super Inu Next?
Volume trends remain the single biggest factor. Thin volume on a small-cap meme token means every wick gets exaggerated.
Liquidity currently sits near $202K, locked according to project claims. A locked pool reduces one risk, rug-pulls, but doesn't touch the concentration risk of sitting in wallets.
Whale activity is the variable to track daily. With 98.85% concentration, a handful of transactions could reshape the entire chart.
New exchange or aggregator listings tend to bring fresh volume. Traders sometimes track upcomingexchange listings for exactly this kind of catalyst.
Trader Takeaway
Super Inu delivered a fast, loud rally built on marketing and thin early liquidity, not fundamentals.
RSI and MACD both lean bullish short-term, but volume already cooled from the launch spike.
Whale concentration near 99% is the number that matters most here. That risk doesn't show up on a price chart, but it decides outcomes.
Anyone tracking this token should watch volume and wallet movement before price alone. Price without volume confirmation, on a token this new, is noise dressed up as a trend.
For a wider read on how new tokens like this typically behave, recentmemecoin news coverage offers useful context.
Disclaimer
This article is for informational purposes only and does not constitute financial, investment, or trading advice. Cryptocurrency markets, and especially newly launched memecoins, carry extreme volatility and risk of total loss. Data referenced reflects figures visible at the time of writing and may change quickly. Independent research and consultation with a qualified financial advisor is recommended before making any trading decisions.