SuperRare (RARE) just ripped through a multi-month range, and traders want to know if $0.07 is even on the table. This SuperRare price prediction breaks down the setup using data as of 14:19
SuperRare (RARE) just ripped through a multi-month range, and traders want to know if $0.07 is even on the table. This SuperRare price prediction breaks down the setup using data as of 14:19 UTC on September 26, 2026, when RARE trades around $0.0219, up roughly 65% on the day. For context on where other tokens stand right now, theprice prediction hub tracks similar setups across the market.
Momentum is stretched. RSI sits at 85.38, deep in overbought territory, based on data from CoinMarketCap. Resistance sits near $0.0324, support near $0.0148. If resistance breaks, the next Fibonacci level opens near $0.0458. If support fails, the range low returns fast.
SuperRare Price Prediction: Quick Prediction Box
Metric
Data
Current Price
$0.0219
24H Change
+65%
Trend
Bullish breakout, overbought
Immediate Target
$0.0324
Upside Target
$0.0458
Support
$0.0148
Resistance
$0.0324
RSI
85.38
Bull Case
$0.0458 to $0.0592
Base Case
$0.0219 to $0.0270
Bear Case
$0.0148
Invalidation
Below $0.0148
SuperRare Price Prediction Today
RARE opened near $0.0159 and pushed as high as $0.0242 in a single session. That's a two-day move most altcoins never see.
Volume on the day sits above $138M, an increase of more than 2000% versus prior sessions, according to CoinMarketCap. Market cap sits near $17.7M to $19.4M depending on the exchange snapshot used.
Trend reading right now: bullish, but stretched. The candle on the daily trading chart closed green with a long wick, which usually means late buyers chased price.
That's a warning sign, not a green light.
RARE Technical Analysis and Key Price Levels
Every level below comes from the same Fibonacci extension drawn off the prior range low, visible on theTradingView chart for RAREUSDT.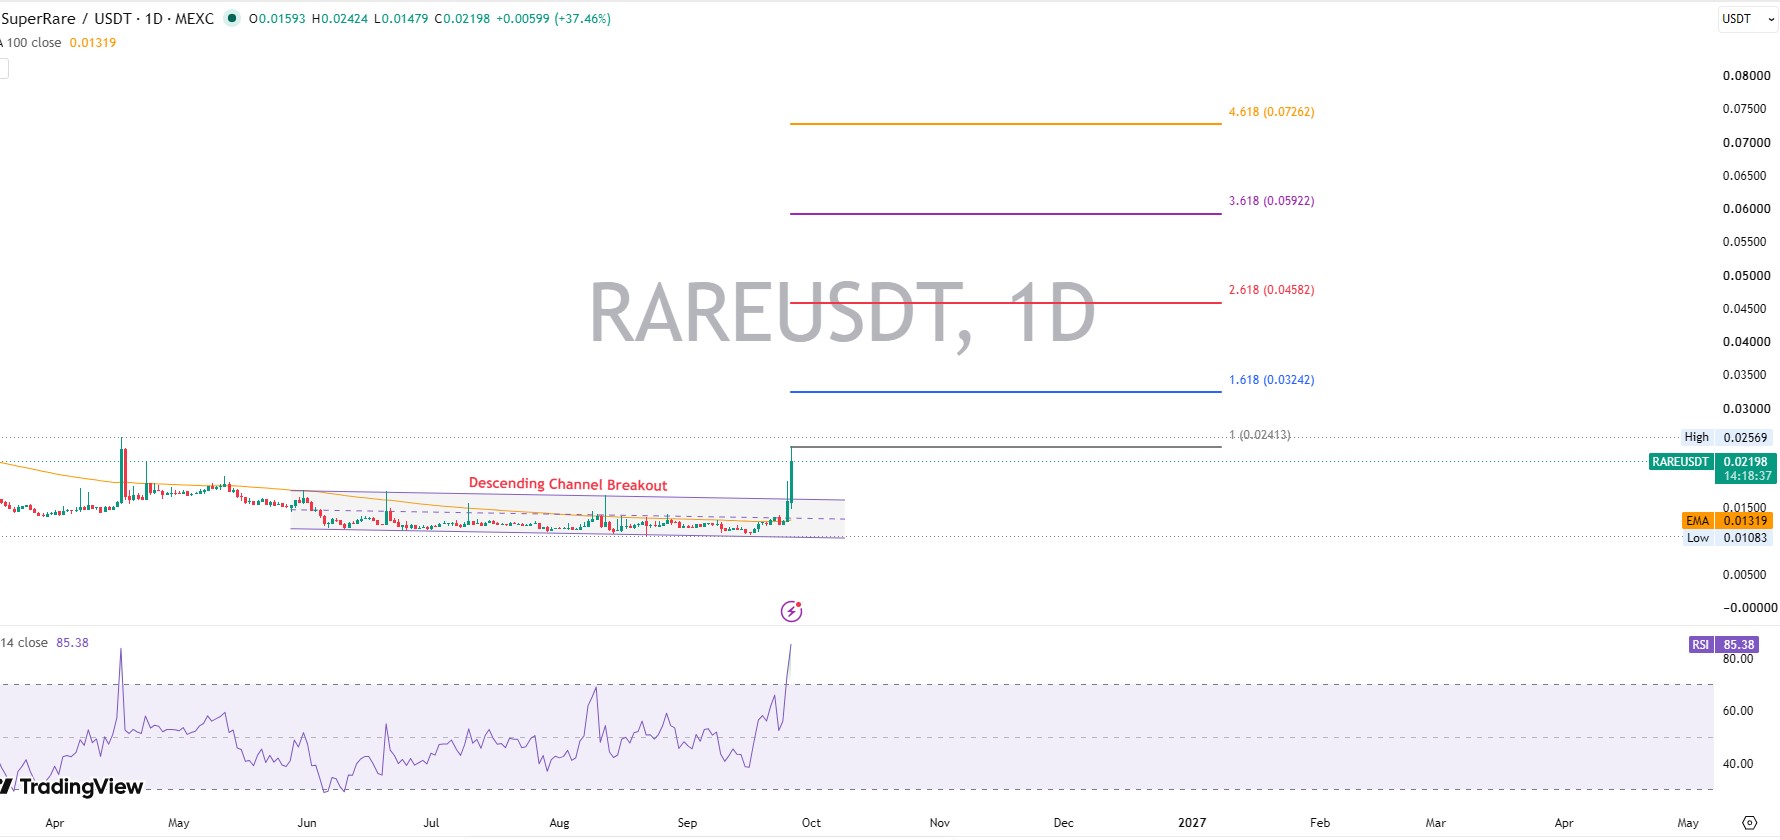
RARE Support Levels
The main support zone sits at $0.0148, matching the low of the descending channel RARE traded inside for months. Below that, $0.0132 marks the range floor from earlier in the year.
A trade back under $0.0148 would undo most of the recent breakout story. Buyers need to defend this zone. And if they don't, the channel breakout gets treated as a fakeout by most chart readers.
RARE Resistance Levels
Immediate resistance sits at $0.0241, the prior swing high. Above that, the 1.618 Fibonacci extension lands at $0.0324, a level RARE hasn't tested in this cycle.
Turns out, resistance zones drawn from old highs tend to attract profit-taking fast. Expect selling pressure the first time the price touches $0.0324.
RSI and Momentum
When the RSI reading was pulled from the daily chart, the number that stood out was 85.38. That's well past the standard 70 overbought line.
Readings this high don't guarantee a reversal. But they do mean upside from here gets harder to sustain without a pullback first.
Here's the thing: overbought conditions can stay overbought during a genuine breakout. Momentum traders watch this exact tension play out for a full week before deciding.
MACD and Trend Confirmation
MACD sits at 0.00110, above its signal line at 0.00032, with a rising histogram near 0.00078. That's a clean bullish crossover.
The crossover happened right as the price broke the descending channel. Confirmation like that carries more weight than a crossover on a quiet day.
The trend signal agrees with the breakout.
Volume and Breakout Confirmation
Price breakout plus volume expansion equals stronger confirmation. RARE's volume expansion, tracked live on CoinGlass, came in above 2000% against recent averages.
Price breakout with weak volume raises fakeout risk instead. That is not what happened here. Volume backed the move, which matters more than the candle color alone.
Can SuperRare Break the Next Resistance?
Bullish Breakout Scenario
A confirmed move above $0.0241 with volume holding above $100M daily opens the path toward $0.0324, then $0.0458. Bitcoin needs to stay stable, and broader NFT-sector coins need to hold their own bounces.
New listings help too. A freshexchange listing often pulls in the volume a breakout needs to hold.
Base-Case Scenario
Without a clean breakout, RARE likely chops between $0.0219 and $0.0270 for a stretch. Range trading after a sharp pump is common. And it's not a bad outcome for a token that just moved 65% in a day.
Bearish Breakdown Scenario
A trade back under $0.0180 would signal exhaustion. Below $0.0148, the breakout thesis fails outright, and RARE likely retests $0.0132 or lower.
Short-term traders on Binance already show a long/short ratio near 0.99, close to even. That's not full conviction either way.
RARE Invalidation Level
The invalidation level for this entire bullish setup sits at $0.0148. A daily trade below that price, especially on strong volume, cancels the breakout thesis. Recent hype around new collection drops, including the launchdetailed on X, won't matter much if that floor breaks.
SuperRare Price Prediction 2026
Scenario
2026 Target
Main Driver
Invalidation
Bear
$0.0132
Weak NFT demand, volume fades
Above $0.0219
Base
$0.0270
Range trading, gradual recovery
Below $0.0148
Bull
$0.0458
Breakout holds, market strength
Below $0.0148
The bear case assumes volume dries up fast, the way it often does after a 2000% spike. The base case assumes $RARE holds its gains without extending them. The bull case needs both a resistance break and broader crypto strength behind it.
SuperRare Price Prediction 2027-2030
Year
Bear
Base
Bull
Main Driver
2027
$0.010
$0.030
$0.065
NFT and crypto cycle timing
2028
$0.012
$0.040
$0.090
Platform adoption
2029
$0.014
$0.048
$0.110
Broader market cycle
2030
$0.016
$0.055
$0.135
Platform and sector growth
What Could Drive RARE Price Higher?
NFT Market Recovery
A broad NFT recovery lifts every token tied to art and collectibles, RARE included. Freshpresale and launch activity across the sector tends to pull attention back toward established NFT marketplaces first.
Active collection launches keep the platform relevant. Recent releases, including multi-edition drops from established artists, generated real mint volume this week alone.
Exchange Liquidity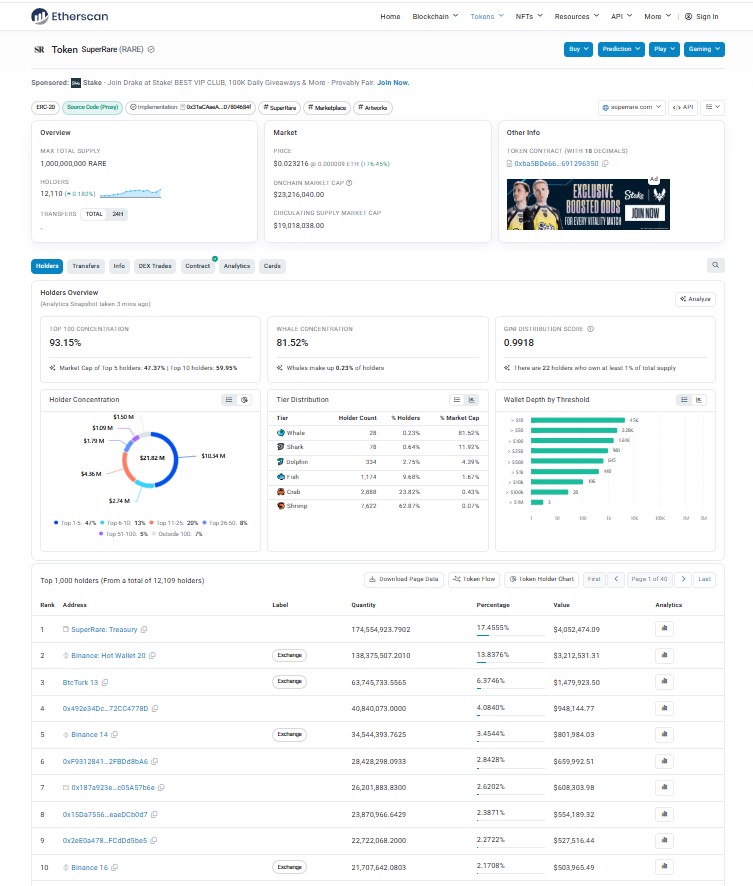
Holder concentration matters here. On-chain data from Etherscan shows the top ten wallets hold a large share of supply, which can cut both ways for liquidity.
Bitcoin and the Broader Crypto Market
RARE doesn't move in isolation. When the Bitcoin price holds steady, altcoins get room to run. When it doesn't, small-cap NFT tokens usually get hit first and hardest.
Bitcoin trades near $84,139.51 as of this snapshot, down 0.39% on the day, with market cap at $1.69T. Volume (24H) sits at $28.8B, down 13.45%, and circulating supply reads 20.08M BTC against a max supply of 21M BTC. A move like that, a small daily dip on lighter volume, usually means the broader market is pausing, not reversing.
A pause like that gives tokens like $RARE room to keep their own momentum, at least for now. And if Bitcoin turns lower with real volume behind it, that room disappears fast.
RARE Token Utility
Utility tied to minting fees and platform governance keeps demand from disappearing entirely. Ongoingairdrop and reward activity across the sector also keeps new wallets engaged with tokens like RARE.
What Could Push $RARE Lower?
A Bitcoin correction drags most altcoins down with it, RARE included. Weak NFT demand alone has already cut RARE's price by more than 99% from its all-time high near $3.79.
Liquidity deterioration is a real risk given how concentrated the holder base is. Exchange-related risk, including sudden large wallet movements, can spook short-term buyers fast.
Failure at resistance near $0.0241 or $0.0324 would confirm the rally is running out of steam. A breakdown below $0.0148 does the same, just faster.
Broader altcoin weakness rounds out the risk list. Checking thecrypto events calendar for scheduled catalysts helps traders avoid being caught off guard by unrelated market news.
Competitor-Token Analysis
Relevant structural competitors include BLUR, TNSR, and RARI.
Metric
RARE
BLUR
TNSR
RARI
Network
Ethereum
Ethereum
Solana
Ethereum
Market cap
~$13.4M
~$60.6M
~$20.4M
~$2.36M
24H volume
~$59.3M
~$10.8M
~$8.1M
~$148K
Circulating supply
825.4M
2.90B
526.9M
19.5M
Main role
Art marketplace/protocol
NFT marketplace
NFT marketplace
NFT protocol/governance
Key narrative
Curated digital art + Rare Protocol
NFT trading
Solana NFT infrastructure
Creator/NFT protocol
Current market figures: BLUR ~60.55M market cap and~10.8M volume; TNSR ~20.36M and~8.11M volume; RARI ~2.36M and~148K volume.
Disclaimer
This article is for informational purposes only and does not constitute financial, investment, or trading advice. Cryptocurrency markets are highly volatile, and prices can move sharply within short periods. Readers should conduct independent research and consult a licensed financial advisor before making any investment decisions. Past performance, including any price levels or scenarios described above, does not guarantee future results.