Can a token that jumped 20% in a day keep climbing, or is the chart baiting late buyers? Buyers pushed DEBIT to $1.40 at about 11:30 UTC on Nov 2, and the latest Teller price prediction hinge
Can a token that jumped 20% in a day keep climbing, or is the chart baiting late buyers?
Buyers pushed DEBIT to $1.40 at about 11:30 UTC on Nov 2, and the latest Teller price prediction hinges on whether $1.16 holds.
Longer-range levels sit in theTeller 2026 to 2030 targets breakdown.
Teller Price Prediction: What Is Happening Now?
Current Price and 24H Move
DEBIT is up. Fast.
CoinMarketCap shows $1.39, a gain of 18.53% in 24 hours, while KuCoin's 4-hour chart prints $1.4015.
The candle on Nov 2 opened at $1.1682. Buyers tagged $1.5944 before sellers answered, a spike of roughly 36%.
Then the price slid back to $1.4015, still green and still above every major moving average except one.
DEBIT Data Snapshot
Readings fromCoinMarketCap's Teller page put the token at rank 590th.
Metric
Reading
Price
$1.39
24H change
+18.53%
24H volume
$11.56M
Market cap
$23.95M
Fully diluted value (FDV)
$139.12M
Circulating supply
17.22M of 100M DEBIT
Volume rose 63.31% to $11.56M, which equals 47.69% of market cap. That's heavy turnover for a token this size.
FDV prices in all 100M tokens, yet only 17.22M circulate. And that gap is supply buyers still have to absorb.
Why Is DEBIT Moving Today?
The Teller'sofficial X post says agentic, meaning AI-run, no-collateral loan pre-qualifications keep rising on its DEBIT AI product, with October the biggest month yet.
But no loan volumes or user counts came with it, so the claim can't be checked.
Harder evidence sits in volume and in the break from the sideways base.
Teller Technical Analysis: How Price Traveled to $1.40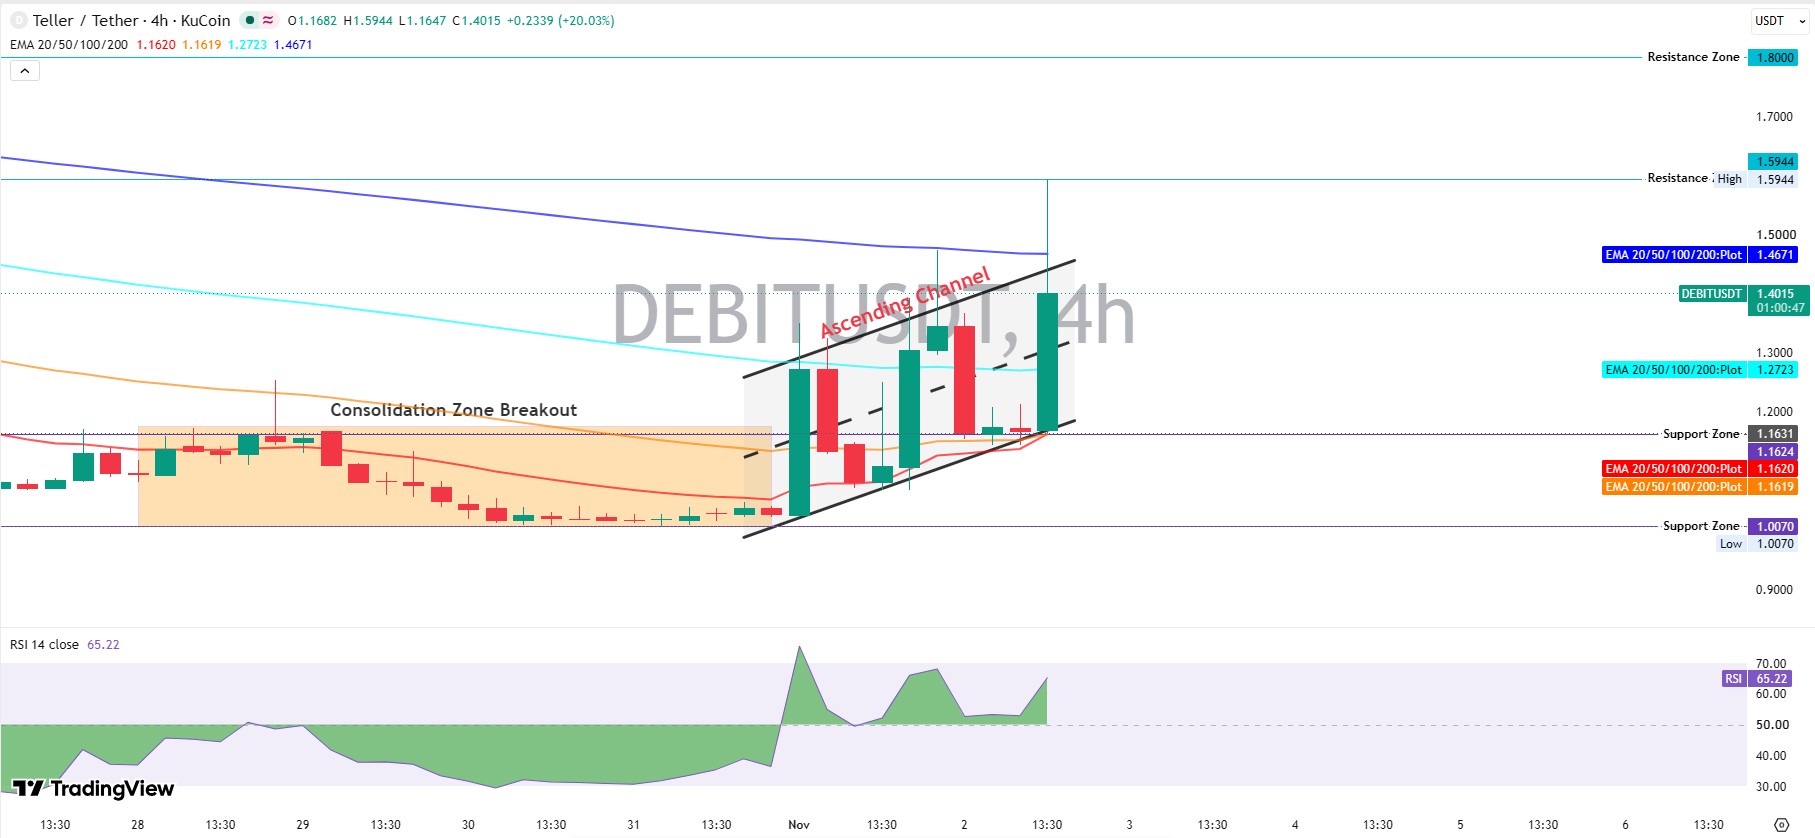
For several days the price drifted sideways between $1.0070 and about $1.20, and RSI sagged near 30.
On Oct 31, a large green candle punched out of that base. RSI spiked near 75.
Since then, the price has climbed inside an ascending channel, with two rising trendlines that keep pullbacks shallow.
Each dip found buyers near the lower line, where the 20 and 50 EMAs (exponential moving averages, trend lines that weight recent trades) sit at $1.1620 and $1.1619.
Now the climb has hit a wall. The 200 EMA at $1.4671 turned price away after that wick to $1.5944.
RSI reads 65.22. The move seemed overheated at first. On second thought, that's under 70, so momentum isn't spent yet.
Key Support Levels
The first floor is $1.1631, where the lower channel line meets the 20 EMA and 50 EMA.
The 100 EMA at $1.2723 works as a cushion above it.
If $1.1631 breaks, then $1.0070, the base low, is next.
Key Resistance Levels
Sellers already defended $1.4671, the 200 EMA, and the $1.5944 wick high sits just above.
A round $1.8 is the next magnet after that.
Is $1.4671 a ceiling or only a speed bump?
Unless buyers reclaim it with volume, every bounce stays a bounce.
The all-time high of $4.34 is a long way off, with price 67.67% below it.
Whale Concentration Behind the Rally
BscScan holder data shows 14,511 wallets, yet whale concentration hits 99.59% across 22 addresses.
A single wallet holds 82.78% of the supply, worth about $117.1M. The top 5 holders own 92.53%.
Retail is thin, with 13,993 shrimp wallets (the smallest holders) owning under 0.01% of market cap.
That thin float explains how $11.56M in volume pushed the price 20% in hours.
Because the top wallet controls so much. Whales decide how far this rally runs.
But Binance Alpha's router holds 0.5469% of supply, about $773,799, so some exchange liquidity exists.
Teller Price Prediction for November 2026
Bias stays bullish while price trades above $1.1631 and turns defensive below it.
Bull Case
If buyers reclaim the 200 EMA at $1.4671 on rising volume, $1.5944 comes first.
A DEBIT price target of $1.8 opens if that wick high breaks, and freshexchange listing news could add fuel.
Base Case
Sideways trade between $1.2723 and $1.4671 is the likeliest path. Volume fading from $11.56M would fit it.
Bear Case
A drop under $1.1631 breaks the ascending channel and the EMA cluster. And sellers would test $1.0070, with the all-time low of $0.8172 beneath it.
Scenario
Trigger
Target
Invalidation
Liquidity Condition
Bull
Trades above $1.4671 on rising volume
$1.5944, then $1.8000
Trades under $1.2723
Volume holds above $11.56M
Base
Holds between $1.2723 and $1.4671
$1.2723 to $1.4671
Trades above $1.5944 or under $1.1631
Volume fades from $11.56M
Bear
Trades under $1.1631
$1.0070, then $0.8172
Trades above $1.2723
Whales sell into thin order books
Risks That Could Break the Setup
Rejection at $1.4671 is the nearest threat, since price already failed there once.
Whale selling is the bigger one. A single transfer from the top wallet would swamp $11.56M in daily volume.
And the AI loan claim stays unverified, with no figures attached. CertiK's rating of 3.8 stars on CoinMarketCap says security isn't flawless either.
Traders tracking AI tokens can followAI crypto news for sector mood.
Where the Setup Stands
Bullish for now, fragile underneath.
This Teller price prediction favors buyers above $1.1631, with $1.4671 as the line that decides the next leg. But a single wallet can flip that overnight.
Traders comparing setups can browsemore crypto price predictions across other coins.
Disclaimer: This article is for information only and isn't financial advice. Crypto prices swing hard, and small tokens like DEBIT swing harder. Readers should research independently before trading. Market data came from CoinMarketCap, BSCScan, and KuCoin via TradingView at about 11:30 UTC on Nov 2, 2026.