A meme coin nobody was watching a month ago just ripped through its own trendline. $TENDIES sits near $0.0220 right now, up 43% over the past day, fresh off breaking out of the ascending chan
A meme coin nobody was watching a month ago just ripped through its own trendline. $TENDIES sits near $0.0220 right now, up 43% over the past day, fresh off breaking out of the ascending channel it had been grinding inside since mid-July. Is this a real leg up, or a social-media sugar rush about to fade? This TENDIES price prediction breaks down the chart, the wallet count, and what the breakout needs to hold.
Why TENDIES Just Broke Its Own Trendline
Something clicked for $TENDIES this week. The coin chopped inside an ascending channel for close to three weeks, then a single session sent it through the upper band on real volume.
That is not nothing. Per CoinMarketCap, $TENDIES trades near $0.0220, up 43.69% in 24 hours, with 24-hour volume near $3.26 million, up 93.71%. Volume-to-market cap sits at 15.25%, a level that usually points to fresh buyers.
Turns out, social chatter comparing $TENDIES to older meme coins pulled in short-term buyers fast. But fast money leaves fast too.
BingX alone carries close to $738,900 of futures volume, dwarfing MEXC's roughly $108,800.
$TENDIES Technical Analysis
On the TENDIES/USDT 4-hour chart on TradingView, captured on August 4, 2026, around 03:41 UTC, an ascending channel breakout occurred; the latest candle printed an open of $0.02093, a high of $0.02224, and a low of $0.02080, up 5.50% on that candle alone.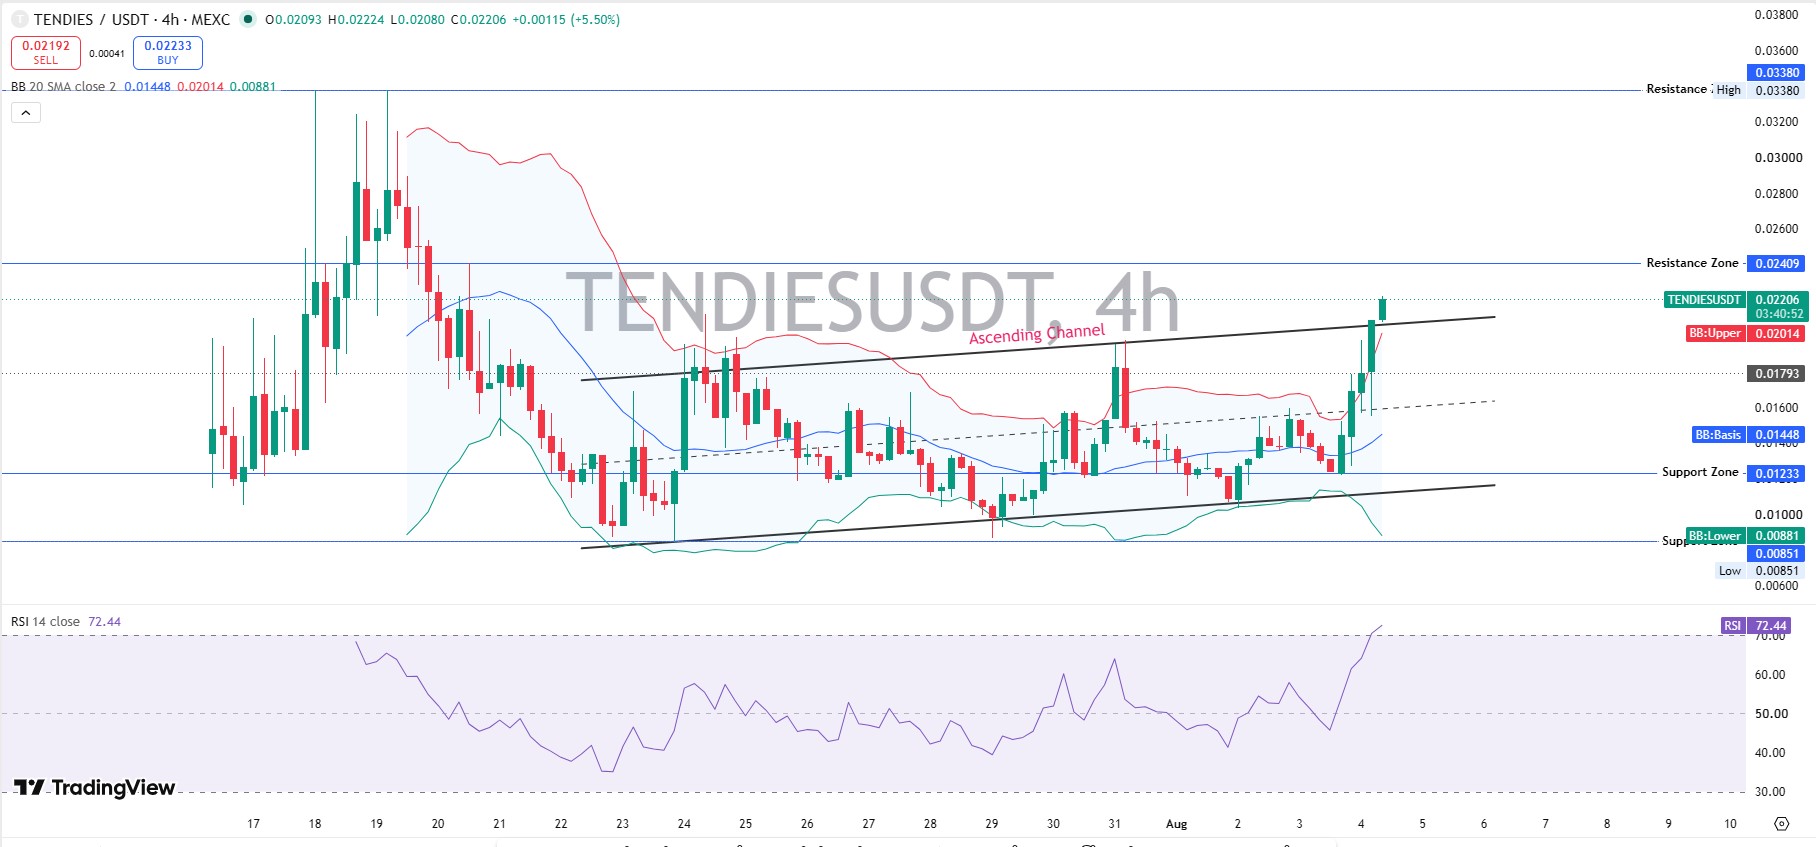
RSI-14 reads 72.44, which is overbought. Price also trades above the upper Bollinger Band at 0.02014, with the basis near 0.01448 and the lower band near 0.00881.
Here's the thing: overbought RSI after a breakout does not guarantee a reversal. But it raises the odds of a cool-off first.
Resistance sits at $0.02409.
Support sits at $0.01233, almost matching CoinMarketCap's 24-hour low of $0.01227. Losing that zone fast would undercut the breakout story.
$TENDIES Support And Resistance Levels
Immediate support: $0.01233, then a deeper floor near $0.00851.
Immediate resistance: $0.02409, then $0.03380.
A break below $0.01233 would invalidate the bullish case. A close above $0.02409 opens the door toward the old high zone.
TENDIES Price Prediction: Scenarios By Timeframe
Timeframe
Bull Case
Base Case
Bear Case
24H
Holds above $0.020, tests $0.0241 (moderate)
Chops between $0.018-$0.022 (high)
Slips under $0.0165 (low)
7D
Close above $0.0241 opens $0.031 (low-moderate)
Range-bound under resistance zone (high)
Close under $0.0123 confirms fade (moderate)
30D
Channel continuation targets $0.031-$0.034 (low)
Drifts $0.015-$0.024 tracking meme flows (moderate)
Retests the $0.00896 all-time low zone (low)
Invalidation for the bullish TENDIES price prediction is a close under $0.01233.
$TENDIES Tokenomics Snapshot
Total, max, and circulating supply all sit at 1,000,000,000 TENDIES, so there is no unlock schedule hanging over price. FDV matches market cap exactly at roughly $19.69 million.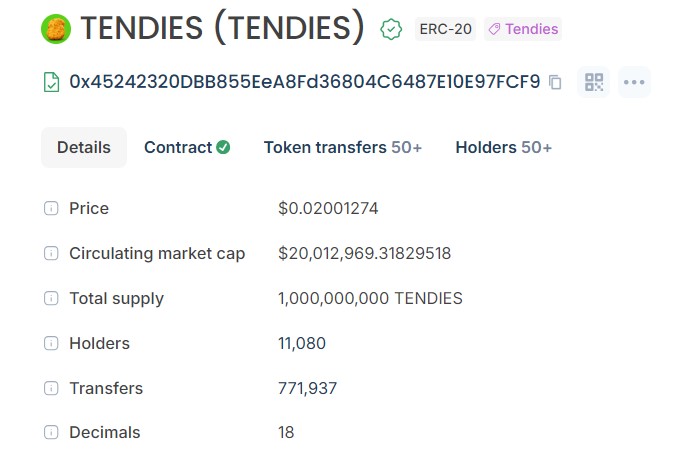
Liquidity-to-market-cap reads 5.80%, thin. A bigger order can move price further than it would on a deeper pair.
On-chain, theTENDIES contract shows 11,080 holders and 771,937 transfers. CoinMarketCap's profile score sits at just 36%, worth noting.
Exchange Volume: Where The Action Sits
Per CoinGlass, futures activity is concentrated, not spread evenly. BingX carries the largest share at roughly $738,900, with MEXC a distant second near $108,800.
Liquidation figures were not available from the permitted sources at writing time, so none are stated here.
$TENDIES And The Memecoin Narrative
$TENDIES is a meme coin, not a utility story. It launched on Robinhood Chain, and this run tracks the earlierrobinhood meme coin rally coverage.
And meme coins move on attention, not fundamentals. A prior spike already sent the token up sharply once, covered in the memecoin jumps 300% apiece, and this looks like a second wind, not a new story.
That pump-cool-off-fresh-pump pattern shows up across the widermemecoin sector constantly. Basically, treat each leg as its own trade.
TENDIES Market Outlook: Risks To Watch
Overbought RSI tops the list. A reading above 70 right after a breakout often precedes a pullback.
Thin liquidity is risk two. A 5.80% ratio leaves this token exposed to sharp wicks.
Macro sentiment matters too. Risk appetite around events like the upcomingFed rate decision tends to spill into small-cap meme coins fast.
Regulatory headlines, including ongoingClarity Act developments, can shift sentiment fast too. Worth scanning acoin event calendar.
Methodology
Chart levels came from the TENDIES/USDT 4-hour perpetual chart on MEXC via TradingView, using RSI-14 and 20-period Bollinger Bands (2 SMA close), captured on August 4, 2026, around 03:41 UTC. Price, supply, and market-cap data came from CoinMarketCap, captured on August 4, 2026, around 03:45 UTC. Holder and contract data came from on-chain tracking of contract 0x45242320DBB855EeA8Fd36804C6487E10E97FCF9 on Robinhood Chain via Blockscout. Exchange volume data came from CoinGlass.
Disclaimer
This is speculative market commentary, not financial or investment advice. Crypto assets are volatile and can lose most or all of their value. Verify live figures before trading.