2026 has been brutal for altcoins. $Bitcoin has clawed its way back from a 21 month low near $58,000 in late June to roughly $80,000, but most of the market never got the memo. Bitcoin domina
2026 has been brutal for altcoins. $Bitcoin has clawed its way back from a 21 month low near $58,000 in late June to roughly $80,000, but most of the market never got the memo. Bitcoin dominance is sitting around 60%, and CoinMarketCap's Altcoin Season Index closed at 34 points in early September, well below the 75 that would confirm a real altcoin season.
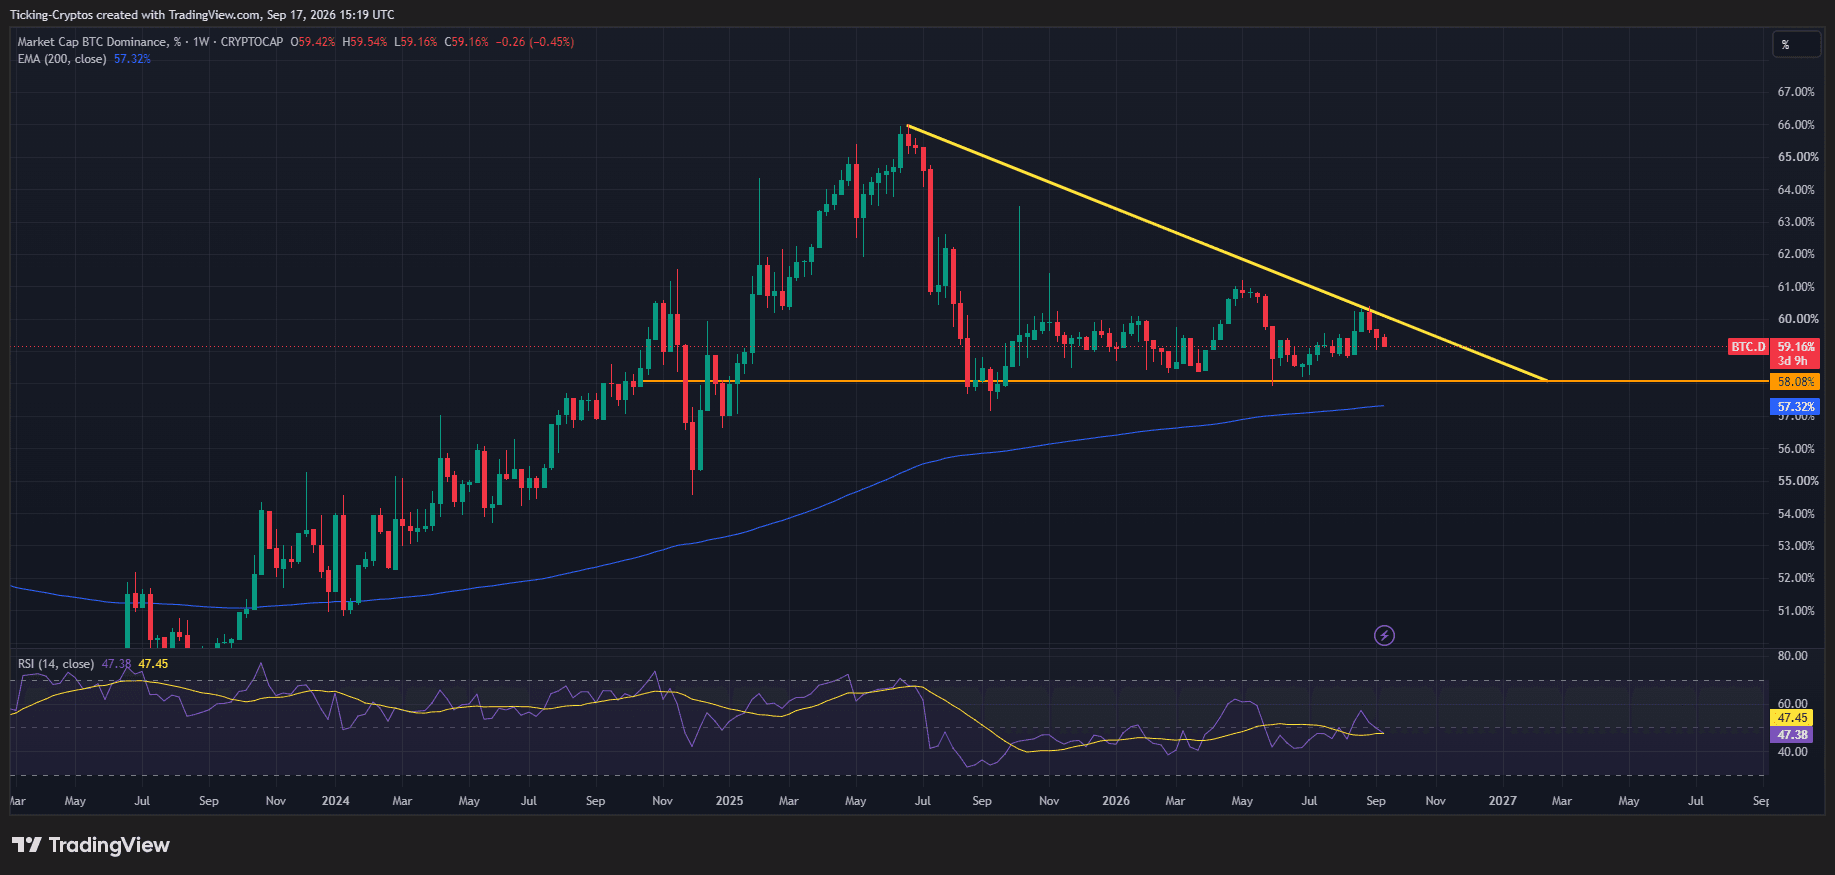
Bitcoin dominance
That gap is the whole opportunity. When capital finally rotates down the risk curve, the assets that move first and hardest are usually the ones that got destroyed on the way down. Below are five low cap altcoins that are deep in the red for 2026, trade on market caps small enough that a modest inflow moves the price, and have something specific going on beyond a sad looking chart.
Why do low cap altcoins reverse fastest in a crypto reversal?
Market cap is leverage in both directions. A token with a $250 million market cap needs a fraction of the fresh demand that a $10 billion token needs to double. That is why small caps fall 70% to 90% in a drawdown while Bitcoin falls 30%, and it is also why they print the violent recovery candles once the flow turns.
The catch is that thin order books cut the same way. Low volume means slippage on the way in and, more painfully, on the way out. Every name below should be treated as a high beta trade on the market, not as a long term hold thesis.
There is also a structural point worth making. Four of the five names here are Ethereum aligned infrastructure. That is not an accident, because that entire sector spent 2026 being repriced. It does mean these coins are highly correlated with each other, so this is not a diversified basket. It is one bet expressed five ways.
Which low cap altcoins are down the most in 2026?
Coin
Price
Market cap
Drawdown from ATH
Sector
Celestia ($TIA)
~$0.35
~$323 million
over 95%
Data availability
Sei ($SEI)
~$0.047
~$330 million
~96%
Layer 1
Starknet ($STRK)
~$0.025
~$200 million
over 97%
ZK Layer 2
Optimism ($OP)
~$0.13
~$287 million
~96%
Layer 2
Arbitrum ($ARB)
~$0.13
~$850 million
~96%
Layer 2
Figures are approximate and taken at the time of writing. Low cap prices move fast, so check live data before acting on anything here.
Can Celestia (TIA) reverse from a $320 million market cap?
The Celestia price sits near $0.35 with a market cap around $323 million and a fully diluted valuation near $411 million. That is a remarkably small number for a project that was one of the most hyped infrastructure launches of the last cycle, and the gap between circulating cap and FDV is unusually tight for a 2023 vintage token, which means unlock pressure is less of an overhang here than it is elsewhere.
Technically, TIA broke out of a multi week descending triangle in late August. The level that matters is a daily close above roughly $0.42. Clear that and the structure opens toward $0.52. Lose the breakout and support sits back near $0.30.
The narrative hook is Celestia's Vision 2.0 and the Fibre upgrade, which targets far higher blockspace throughput. Modular data availability is exactly the kind of story that gets ignored in a risk off tape and re-rated aggressively when traders go looking for beta.
Risk: Celestia's revenue is minimal, and the modular thesis has been out of favour for two straight cycles of narrative rotation.
Is the Sei (SEI) price oversold after a 96% drawdown?
Sei trades near $0.047 with a market cap in the $330 million range and roughly 7 billion of its 10 billion maximum supply already circulating. The SEI price is down about 96% from its all time high, and its one year return sits near minus 86%.
The bull case is mechanical rather than romantic. Sei is a trading focused Layer 1 with parallel execution and an order matching engine built into the chain. Chains that are optimised for trading tend to be the first to see activity return when volumes recover, because speculative flow is their core use case. If volumes come back across the market, Sei's on chain metrics improve before most of its peers.
Risk: roughly 3 billion SEI remain to be released, and the chain has struggled to convert technical throughput into sticky users.
Why is the Starknet (STRK) price one of the cheapest Layer 2 bets?
Starknet is the deepest value name on this list and the most speculative. STRK trades near $0.025 with a market cap somewhere between $160 million and $225 million depending on the data source, against 6.8 billion circulating tokens out of a 10 billion total supply.
This is a genuinely serious piece of zero knowledge infrastructure trading at a market cap smaller than plenty of meme coins. The token has been punished for two reasons that are worth separating: a heavy emissions schedule, and the broader collapse in Layer 2 valuations as fee revenue evaporated after blob fees made rollup costs negligible. The first is a real structural problem. The second is a sector wide repricing that reverses if activity returns.
Staking has given STRK a utility sink it did not have at launch, which at least gives holders a reason to lock supply rather than sell it.
Risk: this is the thinnest book of the five. Daily volume can drop to single digit millions, which means slippage is a real cost, not a theoretical one.
Can Optimism (OP) rebound from near all time lows?
The OP price is around $0.13 with a market cap near $287 million and roughly 2.15 billion of a 4.29 billion total supply in circulation. That puts Optimism about 96% below its all time high and within touching distance of its all time low.
The interesting thing about Optimism is that the token has decoupled almost completely from the technology's adoption. The OP Stack underpins a long list of production chains including Base, and the Superchain framework keeps expanding, yet none of that value historically accrued to the token. Any governance change that routes Superchain revenue back to OP holders would be a genuine repricing catalyst rather than a sentiment bounce.
Risk: the value accrual problem is not solved. Buying OP is a bet that it gets solved, and that bet has been wrong for three years.
Is Arbitrum (ARB) the most liquid reversal play?
Arbitrum is the largest of the five with a market cap in the $800 million to $900 million range and a price around $0.13. It printed a fresh all time low near $0.07 in late June before staging a sharp rally, and it already jumped 26% in a single session in early September while Bitcoin and Ethereum both slipped. That tells you the trading interest is there.
The catalyst is concrete. Robinhood launched the public mainnet of Robinhood Chain, an Arbitrum Orbit Layer 2 built for tokenised real world assets and 24/7 trading. A retail broker with tens of millions of accounts settling on your stack is the kind of distribution that eventually shows up in fee data.
Arbitrum also has the deepest liquidity here, which matters more than people admit. It is the one name on this list you can size properly and exit without wrecking the price.
Risk: roughly 92.65 million ARB unlock mid September as part of a recurring monthly cadence, split between team, advisors and investors. Two Arbitrum based DeFi apps were also exploited in July, with AFX Trade losing around $24 million and Ostium around $18 million. Both hit application contracts rather than the core network, but they still weigh on sentiment.
What would confirm the altcoin reversal next week?
Do not buy the story, buy the confirmation. Four signals to watch:
- Bitcoin dominance below 59%. Dominance closed recently above 60% after clearing a descending trendline. A rejection here is the single cleanest rotation signal.
- ETH/BTC above 0.03426 on a weekly close. The ratio has been hovering near 0.0313. A drop below 0.031 would invalidate the rotation thesis entirely.
- Altcoin Season Index above 50. It sat at 34 in early September. Anything above 50 means breadth is genuinely improving rather than a handful of names bouncing.
- A Bitcoin weekly close above $85,000. That would be the first real evidence that this is more than a bear market rally.
If those line up, low cap altcoins are where the outsized moves happen. If Bitcoin loses $75,000 to $77,000, none of this matters and every name above goes lower than you think possible.
What are the real risks with low cap altcoins?
Three things kill this trade. Token unlocks that dump supply into any strength. Liquidity so thin that a $1 million sell order moves the price 5% to 10%. And correlation, because all five of these names fall together on any Bitcoin flush, so there is no diversification benefit inside this basket.
Cheap is not the same as undervalued. A token that fell 96% can still fall another 50%, and several tokens that looked exactly like these in 2022 never recovered at all. Position size accordingly.