Every transaction on a public blockchain is visible to anyone who knows where to look. The challenge has never been access to the data, it is making sense of millions of daily transfers witho
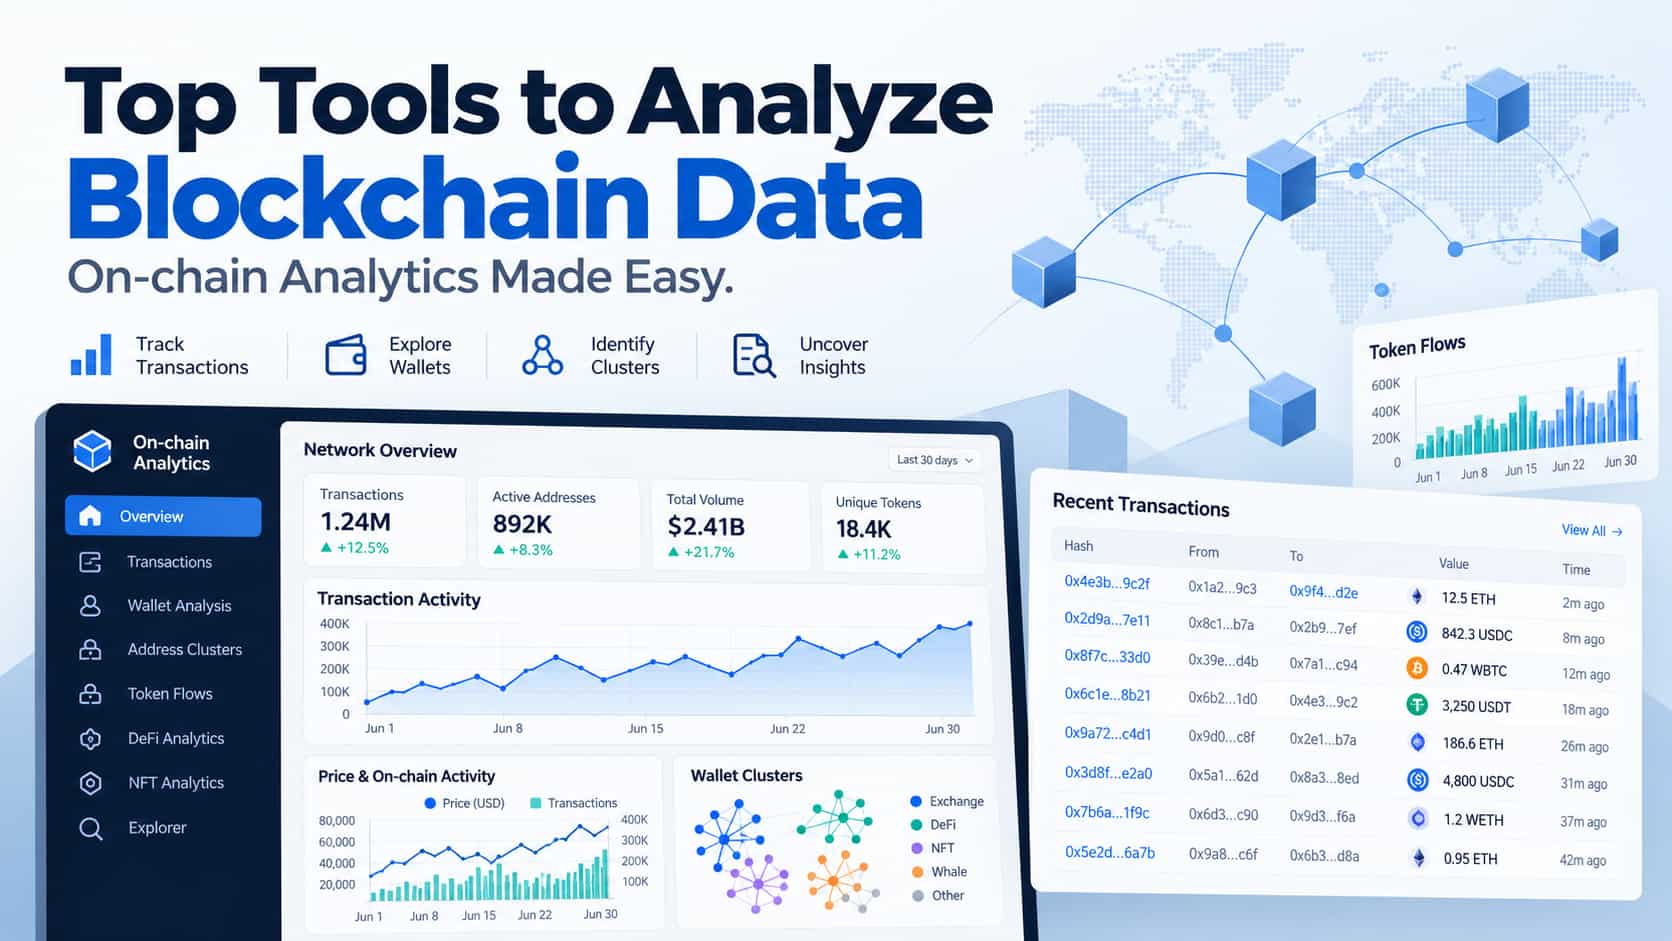
Every transaction on a public blockchain is visible to anyone who knows where to look. The challenge has never been access to the data, it is making sense of millions of daily transfers without spending hours reading raw hashes. That is exactly what modern on-chain analytics platforms solve: they turn raw ledger data into charts, labels, and alerts that anyone can act on. In this guide, we compare the top tools for blockchain analysis in 2026, including what each does well, what it costs, and where it falls short.
Why On-chain Analytics Matters
Reading a block explorer tells you that a transaction happened. Onchain analytics tells you who is behind it, what pattern it fits, and whether it should worry you. Traders use it for wallet clustering to spot insider bundles before a token launch. Analysts use it to measure protocol health. Investigators use it to follow stolen funds across chains. If you have ever wondered how to analyze blockchain data without a data science degree, the tools below are the answer.
1. Bubblemaps: Making Wallet Connections Visible
What it does:Bubblemaps turns wallet activity and blockchain transactions into an interactive bubble graph. Every bubble is a wallet, bubble size reflects holdings, and connected bubbles reveal clusters of wallets that behave as one. This makes it the fastest way to audit token distribution: in seconds you can see whether a new token is genuinely decentralized or whether a handful of linked wallets hold most of the supply.
Key features: visual wallet clustering, on-chain analytics, blockchain analysis, cross-chain coverage, Time Traveller for historical supply snapshots, presale and airdrop detection, and an Intel Desk where the community publishes full investigations. Bubblemaps has become a standard step in token safety checks across Solana and EVM chains.
Free vs. paid: Core bubble maps are as well as advanced features like historical data and deeper Intel Desk access.Limitations: It is focused on wallet relationships and token distribution, so it does not attempt to be a full market data terminal. Pair it with a charting or portfolio tool for trading workflows.
Best for: Traders and researchers who want visual answers instead of spreadsheets, especially for memecoin and new launch safety checks.
2. Etherscan and Chain Explorers: The Universal Starting Point
What it does: Every chain has a block explorer, and Etherscan remains the reference for Ethereum. If you want to learn how to analyze transactions on the blockchain at the most basic level, this is where you start: paste a transaction hash, wallet address, or contract address and see the raw inputs, token transfers, gas, and status.
Key features: full transaction history, verified contract source code, token holder lists, gas tracking, and free public APIs.
Free vs. paid: Completely free for manual use, with API tiers for developers.
Limitations: Explorers show one address at a time. There is no labeling, no clustering, and no alerts, so serious investigation quickly outgrows them.
Best for: Verifying a specific transaction and reading contract details before going deeper.
3. Glassnode: Network Level Metrics
What it does: Glassnode looks at blockchains as economies rather than as collections of wallets. Its metrics on realized cap, exchange flows, and holder cohorts are staples for understanding market cycles.
Key features: hundreds of institutional-grade metrics, curated weekly insights, API access, deep Bitcoin and Ethereum coverage.
Free vs. paid: A free tier with limited metrics, professional plans for the full suite.
Limitations: Not designed for token level research or wallet investigations on newer chains.
Best for: Long-horizon investors tracking network health.
4. Arkham Intelligence: Naming the People Behind Wallets
What it does: Arkham specializes in de-anonymization at scale, linking addresses to real-world entities such as companies, exchanges, and public figures. Its visualizer complements wallet clustering by attaching identities to the clusters you find.
Key features: entity attribution, address visualizer, alerts, and an Intel Exchange where users can buy and sell research bounties.
Free vs. paid: Free tier with an account, premium features paid.
Limitations: Attribution can lag for new or obscure wallets, and coverage outside major entities is thinner.
Best for: Investigators and journalists who need to put a name on an address.
5. Dune Analytics: Build Your Own Blockchain Dashboard
What it does: Dune is a SQL playground over raw blockchain data. Anyone can write a query, publish a dashboard, and fork thousands of community-built ones covering everything from DEX volumes to governance votes.
Key features: multi-chain data warehouse, community dashboard library, API access, full query transparency.
Free vs. paid: Generous free tier; paid plans add faster queries and API limits.
Limitations: You need SQL skills, and queries are only as good as the tables and assumptions behind them.
Best for: Technical analysts and teams that want custom metrics no off-the-shelf tool provides.
6. Nansen: Wallet Labels and Smart Money Tracking
What it does: Nansen maintains one of the largest databases of labeled wallets in the industry, covering exchanges, funds, market makers, and known profitable traders. It answers the question most tools cannot: who is this wallet, and should I follow it?
Key features: 300M+ labeled addresses, smart money dashboards, real-time alerts on tracked wallets, portfolio and profit leaderboards.
Free vs. paid: Limited free tools, with full access on subscription plans that lean professional.
Limitations: Pricing is steep for retail users, and the sheer volume of data can overwhelm beginners.
Best for: Funds and serious traders building strategies around wallet behavior.
How to Analyze Blockchain Data: A Simple Workflow
For anyone wondering how to analyze transactions on the blockchain in practice, most experienced researchers follow the same sequence:
Verify the basics. Paste the token or transaction into a block explorer to confirm the contract is verified and the transfer is real.
Check the holders. Use Bubblemaps to see the token distribution and whether wallet clustering suggests bundled insiders.
Check the contract. Scan for mint functions, honeypots, or blacklist mechanics.
Check the wallets. Look up key holders in Nansen or Arkham to see who they are.
Zoom out. Use Dune or Glassnode for the broader market context.
Quick Comparison
Tool
Strength
Free Access
Limitation
Bubblemaps
Wallet clustering and token distribution
Free
Focused scope, not a full terminal
Etherscan
Raw transaction verification
Free
One address at a time
Glassnode
Network and market metrics
Limited
Not token level
Arkham
Entity attribution
Free
Thin coverage on obscure wallets
Dune
Custom SQL dashboards
Limited
Requires SQL skills
Nansen
Labeled wallets, smart money
Limited
Not token level Expensive for retail
Final Thoughts
There is no single best tool for blockchain analysis, because the job always has layers: raw transactions, wallet relationships, contract safety, and market context. The best blockchain analytics tools stack rather than compete. A practical starting kit for 2027 is a block explorer for verification, Bubblemaps for wallet connections and distribution checks, and a network metrics platform for the bigger picture. Whichever combination you choose, the principle stays the same: the chain never lies, and the tools above make it speak plainly.