Key Highlights TOTAL2 drops to $821.66B — down $202.43B (−19.77%) in a single monthly candle after losing June low One analyst revives February macro double bottom thesis after higher-low rec
Key Highlights
TOTAL2 drops to $821.66B — down $202.43B (−19.77%) in a single monthly candle after losing June low
One analyst revives February macro double bottom thesis after higher-low recovery structure is invalidated
~$770M in leveraged longs liquidated; spot Bitcoin ETFs saw ~$582M single-day outflows, ~$541.1M from BlackRock's IBIT
$900B TOTAL2 reclaim on monthly close is the minimum structural requirement for double bottom thesis
The altcoin market just delivered a structural breakdown. TOTAL2 — the total crypto market capitalization excluding Bitcoin — has lost its June low, erasing the higher-low structure that had kept a near-term recovery thesis intact. Bitcoin itself is trading at approximately $56,233, down 8.43% in the past 24 hours, as broad risk-off pressure from falling technology and AI equities, a stronger dollar, and renewed higher-for-longer rate concerns triggered roughly $770 million in leveraged long liquidations across the market.
One analyst — who first published a macro double bottom thesis for TOTAL2 in February — now says that thesis is back on the table. “Since #TOTAL2 has lost its June low, I’m now back to my initial Macro Double Bottom idea I published back in February,” the analyst wrote. The June low was a key structural anchor. Its loss does not confirm the double bottom is complete — it confirms the previous recovery attempt has failed and the market is now retesting macro support.

Chart Analysis: TOTAL2 (Monthly) | Source: @CryptoBullet1 (X) | Source: @CryptoBullet1 (X)
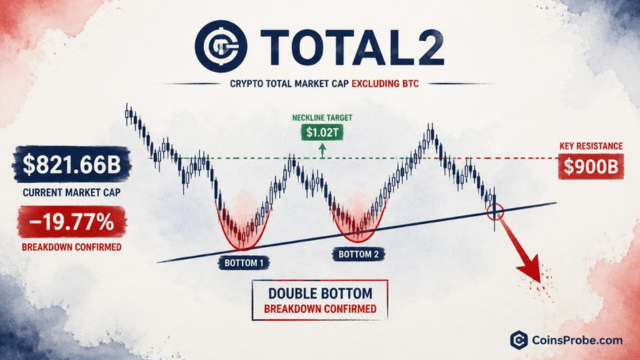
The monthly TOTAL2 chart reflects the severity of the move. The current candle opened at $1.02 trillion, hit a high of $1.06 trillion, and has since collapsed to a low of $816.63 billion — a loss of $202.43 billion, or −19.77%, within a single monthly candle. The closing print at time of writing sits at $821.66 billion. That places price firmly below the lower trendline of the rising channel and below the horizontal support zone near $900 billion — both of which had previously contained the market’s downside. This is not a marginal breach. It is a confirmed breakdown of that structure, as the chart analysis makes clear.
The macro double bottom pattern itself spans years, with two distinct troughs and a rising channel drawn between them. The analyst’s original February thesis anticipated that TOTAL2 could form a second major bottom before launching into a broad altcoin price discovery phase. That thesis was temporarily set aside when TOTAL2 appeared to hold above the June low — implying a higher-low recovery was underway. That read is now invalidated. The market is back inside the lower range of the multi-year formation, and the second trough may still be ahead.
This is not a crypto-native shock. The transmission mechanism is macro. Technology and AI equities sold off sharply, dragging risk assets across the board. Rate expectations shifted hawkish again, reinforcing dollar strength and suppressing institutional appetite for digital assets. The result was a cascade: total crypto capitalization fell approximately 5% to around $2.1 trillion, Bitcoin briefly traded below $60,000, and spot Bitcoin ETFs saw approximately $582 million in single-day outflows — with roughly $541.1 million attributed to BlackRock’s IBIT alone, per data cited in research. Altcoins bore the heaviest relative damage. TOTAL3 — which excludes both Bitcoin and Ethereum — also broke monthly support, reinforcing the breadth of the bearish signal. This is broad deleveraging, not isolated selling.
QCP Capital noted that a durable recovery would likely require stabilization in technology equities, lower rate volatility, and renewed institutional inflows. Fidelity macro strategist Jurrien Timmer remained constructive on Bitcoin’s four-year cycle thesis but acknowledged price had returned to power-law support — a significant acknowledgment that the near-term structure has deteriorated. These are not bullish conditions. They are conditions consistent with a macro bottom formation process — extended, painful, and structurally necessary before the next leg higher can be validated. Those tracking altcoin market structure may also want to reference TOTAL2’s prior pattern breakdown, which flagged earlier structural stress in this same market segment.
A macro double bottom is one of the most powerful reversal patterns in technical analysis — but it is also one of the most commonly misread. The pattern is not confirmed by the second trough alone. It requires a neckline reclaim, sustained above the prior breakdown level, with volume and fundamental backing. In the current context, that means TOTAL2 would need to reclaim the $900 billion support zone — the horizontal level it has now broken beneath — and hold it on a monthly closing basis. That is the minimum structural requirement.
Beyond the chart, two additional conditions are necessary for the thesis to gain credibility: a stabilization in rate expectations (removing the “higher for longer” overhang that has suppressed institutional flows), and a resumption of net ETF inflows into Bitcoin — which historically precede altcoin capital rotation. Neither condition is currently met. The $582 million single-day ETF outflow is the opposite of what the double bottom thesis needs to build on. The analyst’s revival of this thesis is not a buy signal — it is a framework for where the next major floor may form, and what a genuine recovery would need to look like. Meanwhile, broader altcoin stress is visible across individual assets, including XRP’s breakdown below $0.99 channel support and capitulation behavior among large holders — as seen when an ETH whale sold 5,000 ETH at a loss.
TOTAL2 is currently printing at $821.66 billion on the monthly chart — below the $900 billion horizontal support that had defined the lower bound of the prior recovery structure. For the macro double bottom to evolve as the analyst originally outlined in February, price needs to find a credible floor at or near current levels, stabilize, and then build a base over multiple months before any neckline reclaim attempt becomes viable. The risk, if macro conditions continue to deteriorate — particularly if rate volatility persists and ETF outflows continue — is that TOTAL2 continues lower toward the next major support cluster visible on the monthly Y-axis, in the $540 billion range.
The double bottom thesis is a macro framework, not a near-term trade setup. What the analyst’s return to it signals is that the altcoin market has now fully reset to the conditions he identified in February as a potential generational floor zone. Whether that floor holds — or whether a deeper flush completes the right side of the formation at a lower price — depends entirely on the macro variables that drove this breakdown: rates, equities, and institutional flows. Watch the $900 billion TOTAL2 level as the first structural confirmation requirement. Until that level is reclaimed on a monthly close, the double bottom remains a thesis in formation, not a confirmed reversal.
Disclaimer: The views and analysis presented in this article are for informational purposes only and reflect the author’s perspective, not financial advice. Technical patterns and indicators discussed are subject to market volatility and may or may not yield the anticipated results. Investors are advised to exercise caution, conduct independent research, and make decisions aligned with their individual risk tolerance.
Also Read: Anthropic Pulls Off the Biggest IPO in History — Surpassing SpaceX