What to Know TROLL is attempting to recover after rebounding toward the upper Bollinger Band, signaling renewed buying interest. RSI has climbed to 85.71, indicating strong bullish momentum b
What to Know
- TROLL is attempting to recover after rebounding toward the upper Bollinger Band, signaling renewed buying interest.
- RSI has climbed to 85.71, indicating strong bullish momentum but also suggesting overbought conditions.
- A sustained move above the middle Bollinger Band could improve the chances of a broader recovery over the coming years.
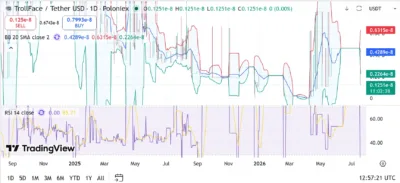
TrollFace (TROLL) is showing renewed signs of strength after recovering from recent lows on the daily timeframe. The latest TradingView chart shows the token trading around 0.1251e-8 USDT, while the Bollinger Bands indicate improving volatility as price rebounds from the lower band toward the middle of the trading range. Meanwhile, the Relative Strength Index (RSI) has surged to 85.71, highlighting aggressive buying pressure.
The recent rebound follows several months of highly volatile price action, where TROLL repeatedly experienced sharp spikes followed by equally steep pullbacks. Despite the unpredictable swings, buyers have returned after defending the latest decline, raising expectations that the token could attempt another recovery if momentum remains intact.
Buyers Attempt to Regain Control
TROLL has spent much of the past year trading in an extremely volatile environment characterized by rapid rallies and deep corrections. The latest move suggests buyers are attempting to rebuild momentum after price stabilized near the lower Bollinger Band.
The recovery toward the middle Bollinger Band indicates improving market sentiment, although the token remains below the upper band, which continues to act as the next major resistance level. A successful breakout above this area would strengthen the short-term technical outlook and could encourage additional speculative buying.
The Bollinger Bands are also beginning to widen, reflecting increasing volatility. Historically, similar conditions have preceded larger price swings, making the coming sessions particularly important for determining the next trend direction.
Technical Outlook
The technical indicators present a mixed but improving picture. The Bollinger Band middle line sits near 0.2264e-8, while the upper band is positioned around 0.6315e-8. Price remains below both levels, meaning bulls still have work to do before confirming a stronger breakout.
However, the RSI reading of 85.71 signals exceptionally strong buying momentum. While this reflects growing demand, it also places the token in overbought territory, increasing the possibility of short-term profit-taking before another advance.
If buyers manage to push TROLL above the middle Bollinger Band, attention could shift toward the upper band as the next major resistance. Failure to maintain the recent recovery could see price revisit the lower Bollinger Band, where buyers would likely attempt to defend support once again.
Source: Tradingviiew
TrollFace (TROLL) Price Prediction (2026–2030)
YearMinimumAverageMaximum20260.15e-80.28e-80.45e-820270.22e-80.40e-80.65e-820280.35e-80.60e-80.90e-820290.50e-80.82e-81.15e-820300.70e-81.05e-81.50e-8
Price Forecast by Year
2026
If buyers successfully defend the recent recovery and establish support above the middle Bollinger Band, TROLL could gradually climb toward 0.45e-8.
2027
Improving market sentiment and stronger trading activity could allow the token to challenge the 0.65e-8 resistance region.
2028
Continued speculative interest and broader cryptocurrency market strength may help TROLL approach 0.90e-8 if bullish momentum persists.
2029
Should the long-term recovery remain intact, increasing liquidity and sustained buying pressure could push the token toward 1.15e-8.
2030
A favorable crypto market cycle, combined with stronger investor participation, could position TROLL to target 1.50e-8, representing its strongest recovery in several years.
Conclusion
TrollFace is showing encouraging signs of recovery after rebounding from recent lows, with the RSI climbing into overbought territory and the Bollinger Bands signaling renewed market activity. Although momentum has improved, buyers must overcome the middle and upper Bollinger Bands before a stronger bullish trend can be confirmed.
The RSI reading above 80 suggests demand has accelerated significantly, but it also increases the likelihood of short-term volatility. Holding above recent support while gradually reclaiming higher resistance levels will remain essential for maintaining the token’s long-term recovery outlook.
FAQs
1. Is TROLL currently bullish?
TROLL is showing improving momentum following a rebound from recent lows, although it still needs to break above key Bollinger Band resistance to fully confirm a bullish trend.
2. Why is the RSI reading of 85.71 important?
An RSI above 85 indicates extremely strong buying momentum but also suggests the token has entered overbought territory, where temporary pullbacks become more likely.
3. What are the key resistance levels?
The middle Bollinger Band near 0.2264e-8 and the upper Bollinger Band around 0.6315e-8 are the primary resistance levels traders will monitor.
4. Can TROLL continue its recovery through 2030?
If broader crypto market conditions remain supportive and buying interest continues improving, TROLL has the potential to sustain a gradual long-term recovery over the coming years.
5. What risks could limit TROLL’s upside?
High volatility, declining trading volume, failure to break above Bollinger Band resistance, and broader cryptocurrency market corrections could slow or reverse the recovery.
Also Read:
The post TrollFace (TROLL) Price Prediction 2026–2030: Can TROLL Hit 0.63 Soon ? appeared first on 36Crypto.