Tron has been quietly coiling into a tighter range for weeks, and that squeeze is now approaching its limit. The Tron Price Prediction for the coming days depends heavily on which side of thi
Tron has been quietly coiling into a tighter range for weeks, and that squeeze is now approaching its limit.
The Tron Price Prediction for the coming days depends heavily on which side of this pattern gives way first.
Tron is a blockchain platform built around content sharing and decentralized applications, with TRX serving as its native token.
It remains one of the largest cryptocurrencies by market capitalization, supported by a large and active user base on its network.
The Tron price today stands at $0.3349, down 1.1% over the past 24 hours. The 24-hour range runs between $0.3319 and $0.3388, with a market capitalization of $31.798 billion.
Live Market Data
Metric
Value
Price
$0.3349
24h Change
-1.1%
Market Cap
$31.798B
Fully Diluted Valuation
$31.798B
24h Trading Volume
$493.448M
Circulating Supply
94.952B
Total Supply
94.952B
Source: market data taken from CoinGecko, as of Sep 16, 2026. Figures may vary slightly across other tracking websites.Exchange Volume
Trading activity remains concentrated on a handful of major exchanges. Binance leads with $48.39 million in 24-hour volume, followed by WhiteBIT at $26.17 million and LBank at $15.22 million. 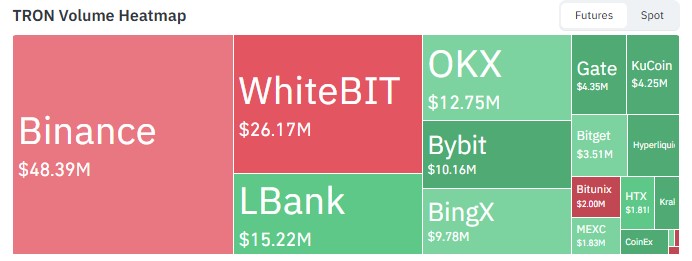
Source: Volume Heatmap Data Taken From CoinGlass, As of Sept 16, 2026.
OKX, Bybit, BingX, and several smaller platforms rounded out the remaining liquidity.
Tron Technical Analysis
The daily TRX/USDT chart on OKX shows price consolidating inside a symmetrical triangle that has been forming since late August. 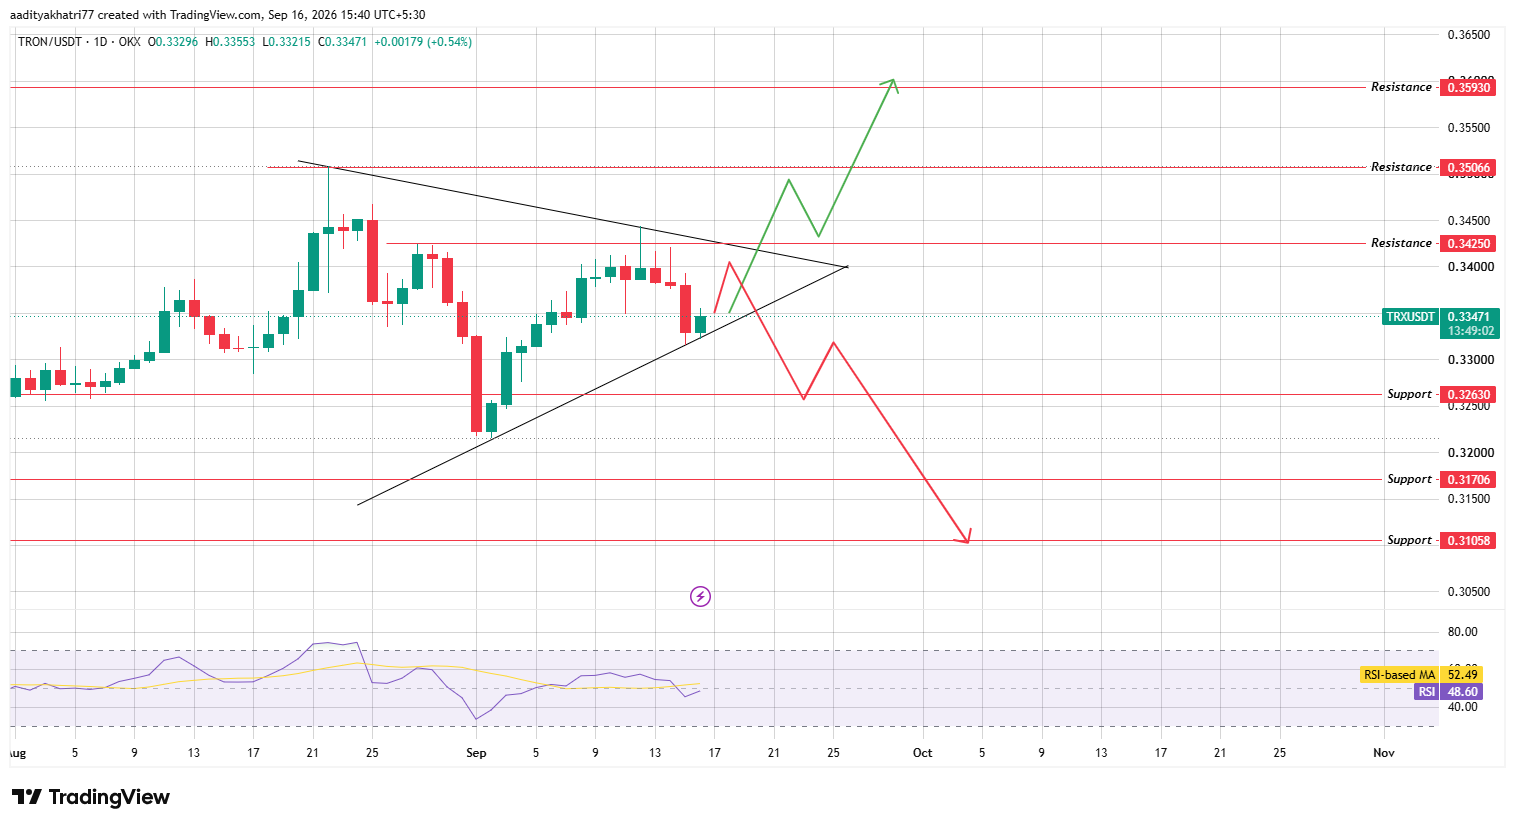
Source: Chart taken from TradingView, as of Sep 16, 2026
RSI sits at 48.60, close to its moving average of 52.49, reflecting the indecision typical of a tightening range.
Can $TRX Break Out Of The Falling Trendline?
A daily candle close above the triangle's falling trendline and $0.34250 resistance, backed by rising volume, would point toward the next level at $0.35066.
Clearing that zone with sustained volume could open a path to $0.35930, a level TRX has not tested since late August.
What Happens If $TRX Breaks the Rising Trendline?
If the price gets rejected near the triangle's apex and breaks below the rising trendline, the first support to watch is $0.32630.
A confirmed close below this level would shift the near-term structure bearish, opening the door to $0.31706 and, in a deeper breakdown, $0.31058.
Support and Resistance Levels
Support
Resistance
$0.32630
$0.34250
$0.31706
$0.35066
$0.31058
$0.35930
Bull, Base, and Bear Scenarios
Scenario
Setup
Level
Bull
Triangle breakout above resistance with volume
$0.34250–$0.35930
Base
Continued consolidation inside the triangle
$0.32630–$0.34250
Bear
Breakdown below rising trendline support
$0.31706–$0.31058
Tron Vs Bitcoin
TRX's recent consolidation has played out alongside a mixed broader crypto market, with Bitcoin Price Today also trading within its own range-bound structure.
As one of the larger-cap altcoins, Tron tends to move directionally with Bitcoin during wider market swings, though tight patterns like this triangle can also resolve independently based on TRX-specific volume flows.
A stabilizing Bitcoin market would likely support a breakout attempt above the falling trendline, while renewed Bitcoin weakness could add pressure toward the rising trendline support.
Methodology
This Tron Price Prediction is based on daily chart analysis of the TRX/USDT pair sourced from OKX via TradingView, covering triangle structure, RSI momentum, and defined support and resistance zones.
Market data reflects figures at the time of writing and can shift quickly. This analysis does not constitute financial advice.
Expert Opinion
Analysts tracking large-cap altcoins generally treat a symmetrical triangle this late in its formation as a sign that a decisive move is approaching.
With RSI sitting near neutral rather than at an extreme, the eventual breakout direction is likely to be driven more by volume confirmation than by momentum alone.
Disclaimer: This article is for informational purposes only and does not constitute financial advice. Cryptocurrency markets are highly volatile, and prices can move sharply in either direction. Support and resistance levels discussed here are technical estimates, not guarantees, and actual price movement may differ significantly. Readers should conduct their own research before making investment decisions.