U.S. spot Ethereum ETFs recorded 23 consecutive trading days of net outflows through October 30, their longest withdrawal streak since launch. Grayscale's ETHA, ETHE and ETHB accounted for mo
- U.S. spot Ethereum ETFs recorded 23 consecutive trading days of net outflows through October 30, their longest withdrawal streak since launch.
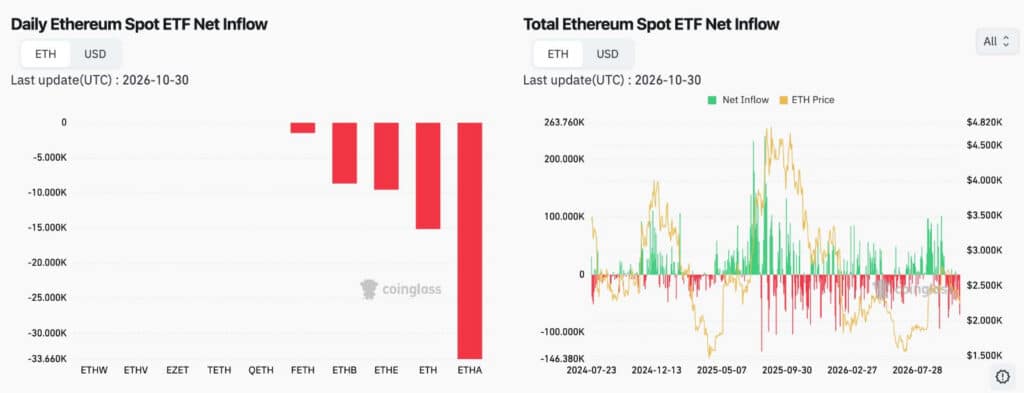
- Grayscale's ETHA, ETHE and ETHB accounted for most October 30 withdrawals, losing approximately 33,660 ETH, 15,000 ETH and 8,500 ETH, respectively.
- The outflow streak follows heavy institutional ETH accumulation in August and September, while Ethereum's price has recovered toward $2,500 from its early-2026 low.
U.S. spot Ethereum exchange-traded funds recorded 23 consecutive trading days of net outflows through October 30, setting their longest withdrawal streak since launch. Glassnode reported the run, which follows heavy ETH accumulation by traditional finance investors in August and September. The latest data also show withdrawals concentrated in several major fund products.
Fund Withdrawals Concentrate in Major Products
The October 30 breakdown showed Grayscale Ethereum Mini Trust, identified as ETHA in the supplied data, recording the largest net withdrawal at approximately 33,660 ETH. Grayscale's ETHE followed with roughly 15,000 ETH leaving the product. Ethereum Trust, listed as ETHB, recorded about 8,500 ETH in net outflows.
Fidelity's FETH saw a smaller withdrawal of around 1,500 ETH. Meanwhile, ETHW, ETHV, EZET, TETH and QETH recorded little or no visible net movement. The figures place most of the day's withdrawals among ETHA, ETHE and ETHB, with ETHA accounting for the largest share.
Flows Have Shifted Since Earlier Inflows
The historical data cover daily net flows from July 2024 through October 2026. They show cumulative flow movements fluctuating substantially during that period, with inflow surges exceeding 200,000 ETH at points. One notable increase occurred around September 2025, when demand for the funds strengthened.
Source:Coinglass
However, the series also includes sizeable withdrawal periods. The largest negative flow episode approached 146,380 ETH. Alongside those movements, the ETH price line climbed toward approximately $4,820 before entering a prolonged decline.
ETH Price Rebounds as Outflows Continue
The price line fell toward $1,500 in early 2026, then recovered toward the $2,500 region. That recovery occurred within the broader period of changing ETF flows, while the latest sessions continued to show net withdrawals.
Glassnode said traditional finance investors had bought heavily in August and September before the current 23-session outflow run. The October 30 breakdown shows that recent withdrawals were uneven across products. Several funds recorded limited movement, while three Grayscale-linked products accounted for most of the reported ETH leaving ETFs.