This Uniswap price prediction starts with where UNI stands today: up 0.3% at $3.85 and just touched its highest price in over 70 days. That's a solid recovery story. UNI has been climbing ste
This Uniswap price prediction starts with where UNI stands today: up 0.3% at $3.85 and just touched its highest price in over 70 days.
That's a solid recovery story. UNI has been climbing steadily off its recent lows and is now creeping back toward the $4 mark, a level it hasn't traded above in a while.
The catch is that this rally isn't drawing much fresh trading activity along with it, and one well-followed trader has flagged $4.00 as a level worth watching closely for a possible pullback.
There's also a holder concentration number worth knowing more than the price move itself, which is covered further below.
UNI Price Snapshot (July 24, 2026)
MetricValuePrice$3.8524h Change+0.3%Market Cap$2.41BFully Diluted Valuation$3.439B24h Trading Volume$144.771MTotal Value Locked (TVL)$3.154BCirculating Supply625.23M UNITotal Supply892.364M UNIMax Supply1B UNI
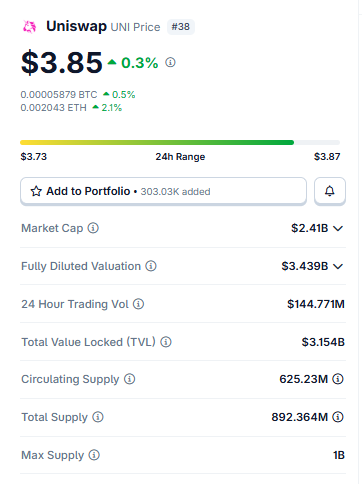
Source: Data Taken From Coingecko, data as of July 24, 2026. Figures may vary slightly across other tracking websites.
A $3.154B TVL against a $2.41B market cap is worth sitting with for a second Uniswap's protocol is doing real, ongoing work as a DEX, and that TVL figure isn't a chart level, it's actual capital parked in liquidity pools right now.
Liquidation Data: A Mixed Signal Across Timeframes
CoinGabbar's derivatives read on $UNI liquidations show something that doesn't tell one clean story: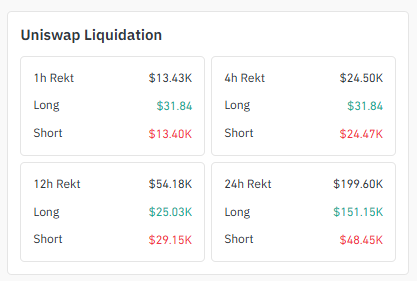
Source: Liquidation Data Taken From Coinglass, at 24-07-2026
WindowTotal RektLong LiquidationsShort Liquidations1h$13.43K$31.84$13.40K4h$24.50K$31.84$24.47K12h$54.18K$25.03K$29.15K24h$199.60K$151.15K$48.45K
Short-term, shorts caught the pain. The 1h and 4h windows are almost entirely short liquidations, which tracks with price grinding higher and squeezing anyone leaning against it.
Pull back to 24 hours, though, and the story flips: $151.15K of the $199.60K total came from longs.
So earlier volatility caught over-leveraged bulls too. Put both together, and it reads like a choppy session that hit each side at different moments, not a clean one-way squeeze.
Exchange Volume Heatmap
Exchange volume on UNI is lopsided right now, one venue way out ahead of the rest. WhiteBIT leads with $147.31M in futures volume, more than double everyone else combined. 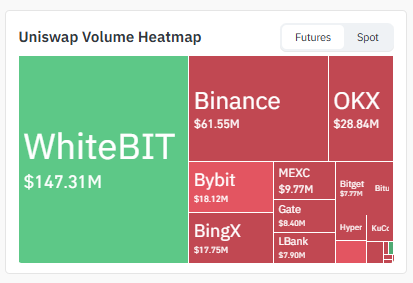
Source: Heatmap Data Taken From Coinglass, at 2-07-2026
Binance sits at $61.55M, OKX at $28.84M, Bybit at $18.12M, BingX at $17.75M. MEXC, Gate, LBank, and Bitget each land somewhere in the $7-10M range, with a few smaller venues trailing behind.
That kind of WhiteBIT dominance matters on its own; when one exchange carries this much of the volume, price discovery there can move ahead of everywhere else.
Holder Concentration: The Real Story Behind the Chart
This is the number that deserves more attention than it usually gets. Uniswap's top 100 wallets hold 82.14% of the total supply.
Go further, and whale concentration hits 96.35% of market cap from wallets that make up just 0.23% of all holders.
The Gini distribution score, a standard inequality measure, sits at 0.9976. About as lopsided as this metric gets. 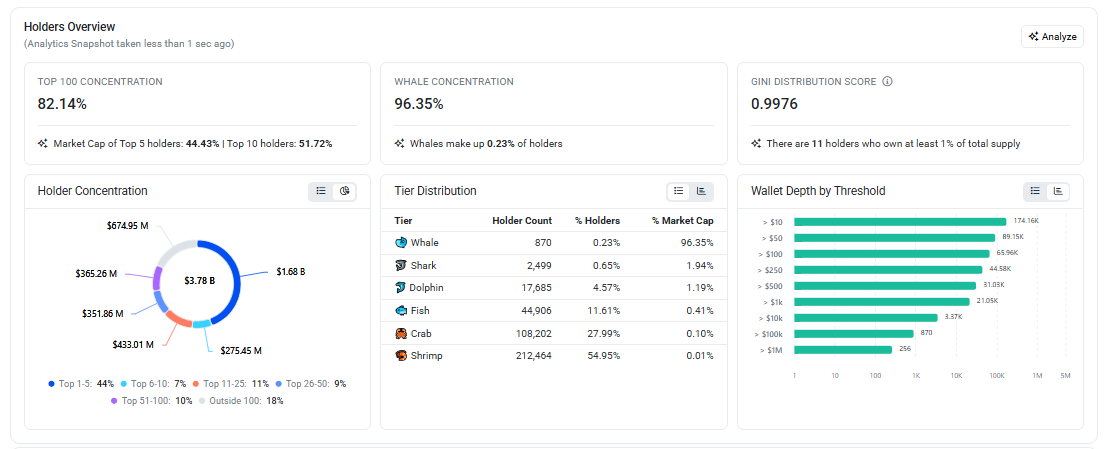
Source: Holder Data Taken From Etherscan at 24-07-2026
Five wallets alone account for 44.43% of the entire market cap; the top ten hold 51.72%, over half of everything, in ten addresses.
Eleven separate holders individually own at least 1% of the total supply.
Break it down by tier and the gap gets starker. 870 whale wallets hold 96.35% of market cap, while 212,464 shrimp-tier wallets, the overwhelming majority of holders by headcount, control just 0.01% between them.
It's a familiar shape in crypto, sure, but rarely this extreme. None of it predicts direction by itself. It just means price can swing hard if a handful of large wallets decide to move, no matter what the chart says.
4-Hour Chart: Textbook Ascending Channel
Zooming into the 4H, the structure gets cleaner. UNI closed at $3.855, up 1.96%, and the price has been climbing inside a well-defined ascending channel, a rising floor and a rising ceiling, both sloping up in parallel since the last major swing low.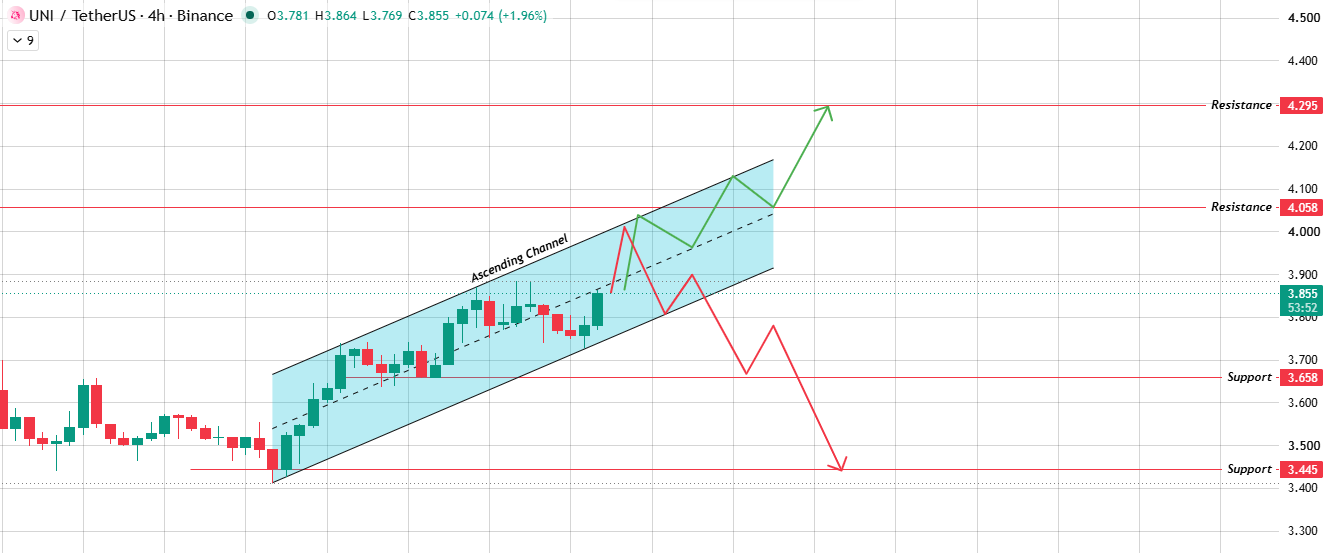
Source: Chart Taken From TradingView, at 24-07-2026
Resistance sits at $4.058 first, then $4.295. Break both with conviction, and $4.295 opens the door toward the daily chart's bigger $4.949 target.
Support underneath sits at $3.658, with a second, more serious floor at $3.445; losing that one would mean the channel itself has failed, not just a pullback within it.
1-Day Chart: An Ascending Triangle, Not Just a Flag
UNI closed the daily candle at $3.856, up 2.64%.
The shape on this chart is actually an ascending triangle, a rising trendline for support underneath, and a flatter ceiling up top that price kept testing and getting turned away from, right around the $3.9–$4.00 area. 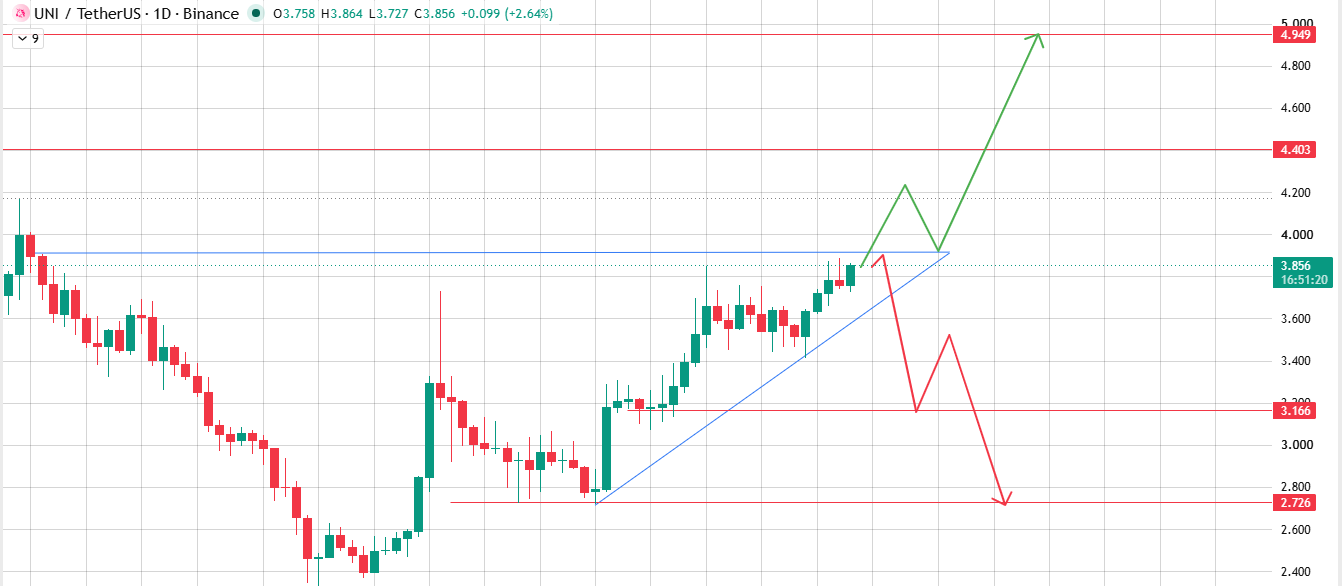
Source: Chart Taken From TradingView, at 24-07-2026
Price has now pushed through that ceiling. Different traders will call this differently; some read the same kind of setup as a bull flag once the breakout confirms.
But the chart itself is drawing an ascending triangle, and that's the more precise read of what's on screen.
Clear $4.403 next, and the level after that sits at $4.949, a real price target if buyers keep showing up. If the breakout can't hold, though, support drops first to $3.166 and then $2.726 if things really come undone.
One thing worth being upfront about: a triangle breakout only means something once the volume shows up behind it. Right now, that part's still up for debate.
$UNI Price Scenario TableScenarioTriggerTarget ZoneBull CaseThe channel holds, and the daily ascending triangle breakout confirms with volume.$4.058 – $4.295 (near-term), $4.403 – $4.949 (extended)Base CaseChannel remains intact, and price consolidates below $4.00.$3.658 – $3.864Bear CaseChannel fails and rejection near $4.00 triggers a bearish breakdown.$3.445 (4H), $3.166 – $2.726 (1D)The Volume Problem Nobody's Talking About Enough
A widely followed trading account had already called this move before it happened, tagging it as a bull flag setup on UNI's daily chart.
The breakout came through, and UNI just marked its highest print in over 70 days. Whether you call the underlying shape a flag or an ascending triangle, the outcome is the same one. 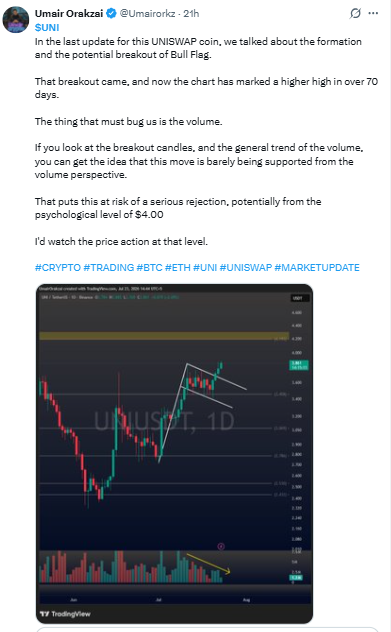
Source: Data Taken From X.
looks like clean confirmation, on the surface. Then comes the catch.
That same trader dug into the breakout candles and the broader volume trend and flagged something uncomfortable: this move is barely getting backed by volume.
Not a great sign. It puts the rally at real risk of snapping back hard, especially near the $4.00 mark.
Round numbers tend to draw profit-taking no matter how good the chart looks. Keep an eye on price action right around there instead of assuming this just runs on its own.
BTC Dominance and ETH Correlation
UNI doesn't move in a bubble; its ETH correlation stays tight given Uniswap's job as an Ethereum-based DEX.
Swings in BTC dominance and broader ETH price action can either boost this kind of chart setup or completely undercut it.
A breakout like this one running into a risk-off macro backdrop tends to fizzle fast; the same breakout with BTC and ETH climbing has actual room to work.
Final Outlook
UNI's chart looks genuinely constructive right now: a healthy ascending channel on the 4H, an ascending triangle breakout on the daily, and a fresh 70-day high on the board.
That's the bull case in a sentence. But the volume warning isn't a footnote, and $4.00 is exactly the kind of round number where breakouts either confirm with conviction or stall and roll over.
Add in a holder base; this top-heavy 96% of market cap sits with under a quarter percent of wallets, and it's clear this move needs real buying pressure behind it, not just a chart pattern doing its thing.
Hold the channel, clear $4.00 on genuine volume, and $4.403–$4.949 is realistic. Fail there, and $3.658 down to $3.445 becomes the more likely near-term range.
Glossary
Ascending Channel: A price structure bounded by two parallel, upward-sloping lines, a rising floor and a rising ceiling, that price bounces between until one side breaks.
Ascending Triangle: A pattern with a flat resistance ceiling up top and a rising trendline for support underneath; price gets squeezed into a smaller range until it breaks, usually to the upside.
Whale Concentration:The share of total supply or market cap held by the largest wallet addresses, used as a measure of how much control sits with a small number of holders.
Gini Distribution Score: A statistical measure of inequality, adapted here to show how unevenly a token's supply is spread across holders; closer to 1 means more concentrated.
Methodology
Every price level here channel boundaries, support, and resistance came directly off the UNI/USDT 1D and 4H charts on Binance, reviewed July 24, 2026.
Holder concentration and tier data reflect an on-chain analytics snapshot from the same time.
Liquidation and exchange volume figures match that window too. Nothing here is extrapolated beyond what the source charts and data show.
This is not financial advice. UNI is volatile, and these levels can shift quickly.
Disclaimer: This article is for informational purposes only and is not financial advice. Cryptocurrency markets are volatile; do your own research before investing.