$UNI just cracked MetaMask's own top-5 swaps list over the last two weeks, right alongside LINK and PAXG. Price is up 10% today and trading near the top of its 24-hour range. But not everyone
$UNI just cracked MetaMask's own top-5 swaps list over the last two weeks, right alongside LINK and PAXG. Price is up 10% today and trading near the top of its 24-hour range.
But not everyone is celebrating. One trader is warning that UNI's entire rally rests on a single partnership staying intact.
This Uniswap price prediction looks at both the momentum and the risk behind it.
Market data was checked on September 12, 2026, based on the chart timestamped 07:38.
Uniswap Price Prediction Today: Market Overview
Metric
Value
Price
$6.4535
24h Range
$5.91 - $6.51
Market Cap
$4.027B
FDV
$5.754B
24h Volume
$686.908M
Total Value Locked (TVL)
$3.685B
Circulating Supply
623.212M
Total Supply
890.46M
Max Supply
1B
Source: Data from CoinGecko as of September 12, 2026, at 7:21 IST. Figures may vary slightly across other tracking websites.
UNI Joins Top Swaps List: DeFi Crypto News Today
MetaMask highlighted $UNI as one of its top swapped tokens on Ethereum mainnet over the past 14 days, alongside LINK, NPC, LIT, and PAXG, in a post recapping user activity on the wallet.
Crypto News Today: UNI Robinhood Dependency Risk Sparks Crypto Debate
$UNI's rally leans heavily on the assumption that Robinhood keeps using Uniswap as its liquidity infrastructure.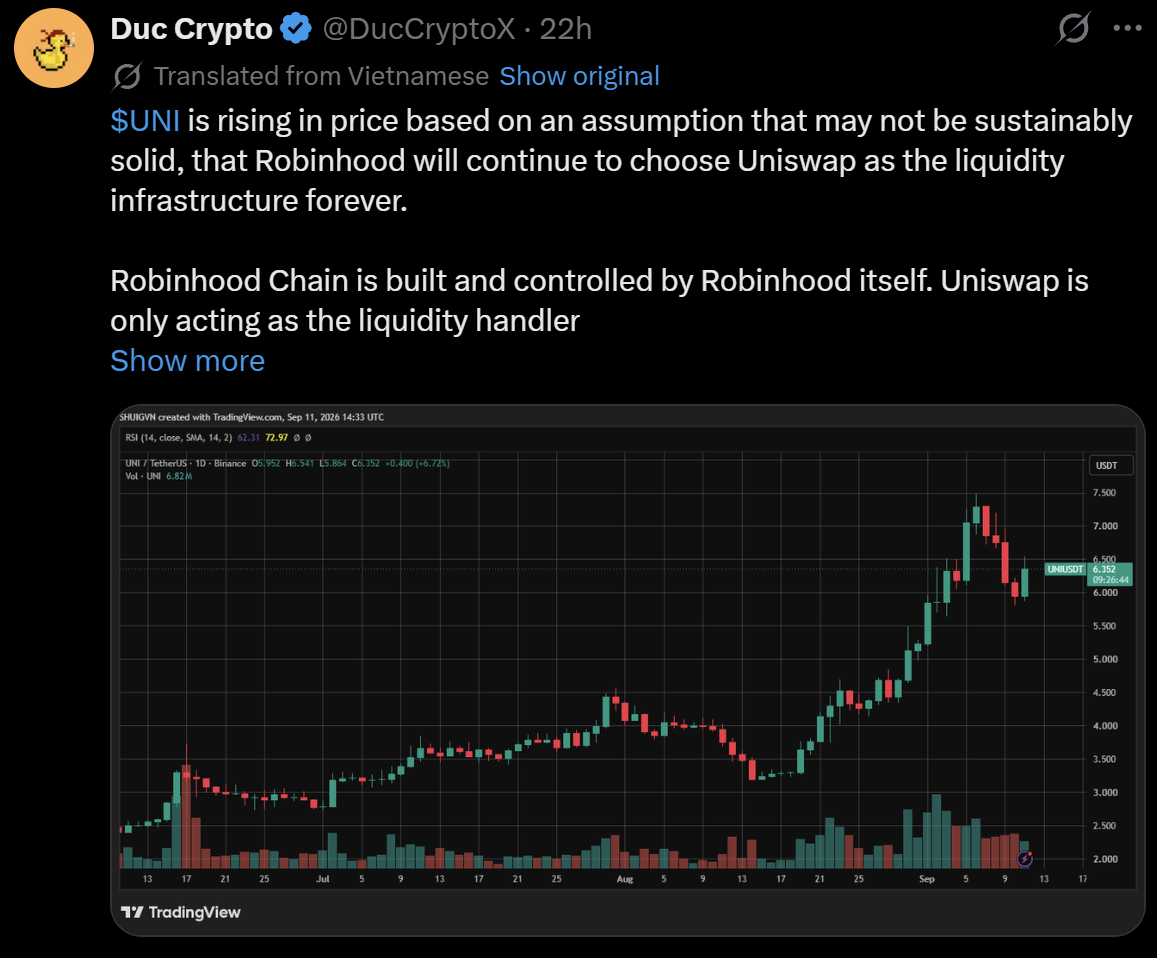
Source: Data From X
The post points out that Robinhood Chain is built and controlled by Robinhood itself, with Uniswap acting only as the liquidity handler rather than the infrastructure owner, so a decision by Robinhood to build its own AMM or switch partners could cut off the fee stream feeding UNI's token-burning mechanism quickly.
The post frames this as $UNI depending on one external partnership rather than a broad DeFi ecosystem and calls that relationship a contract that could change, not a permanent arrangement.
This is one trader's opinion and analysis, not a confirmed development.
$UNI Price Prediction Technical Analysis
Pair: UNI/USD · Market: Spot (Crypto index) · Timeframe: 1D · Timestamp: September 12, 2026, 09:38 UTC-3
UNI trades at $6.4535, up 10% on the daily candle, pushing higher inside a broad rounding-bottom structure that has been building since mid-2025, with converging trendlines pointing toward resistance near $12.0060.
RSI (14, Relative Strength Index) reads 63.54, firmly bullish but not yet in overbought territory.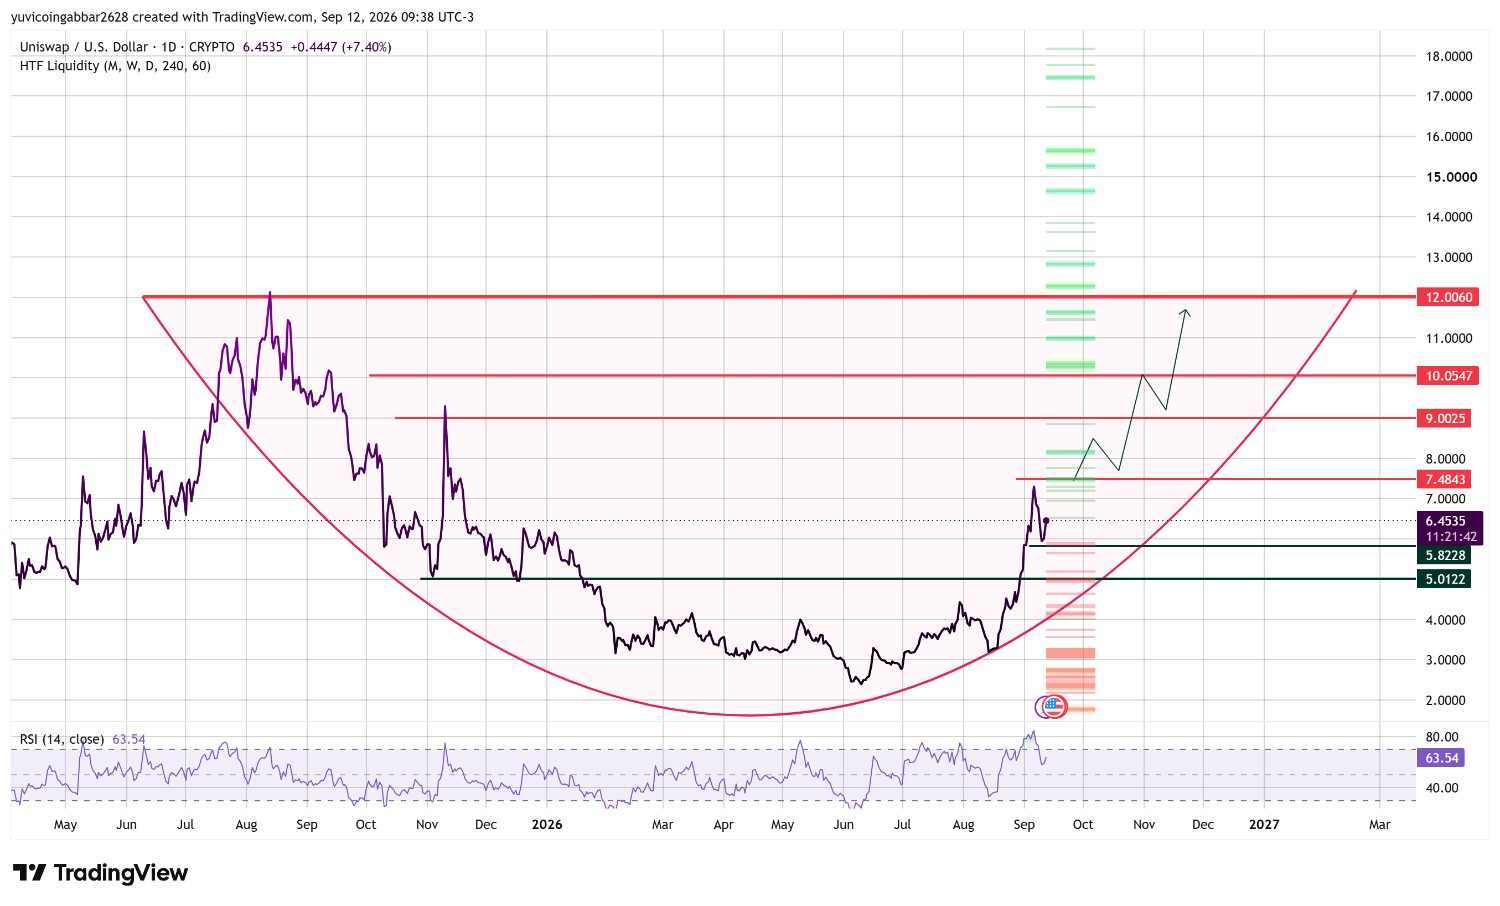
UNI Key Levels to Watch: Uniswap Outlook
Level Type
Price
Resistance 4
$12.0060
Resistance 3
$10.0547
Resistance 2
$9.0025
Resistance 1 (nearest)
$7.4843
Immediate Price Reference
$6.4535
First Confirmed Support
$5.8228
Deeper Support
$5.0122
Uniswap Forecast: Bull Case vs Bear Case
Bull case: Clearing $7.4843 would open the path toward $9.0025 and then $10.0547, with rising RSI and fresh top-swaps demand from MetaMask users both adding fuel to the move.
Bear case: A close below $5.8228 would expose $5.0122. Beyond the chart, the Robinhood-dependency argument raises a structural risk.
If UNI's burn revenue leans mostly on one external partnership rather than broad DeFi activity, any change in that relationship could pressure price regardless of where support and resistance sit.
UNI Triggers and Invalidation
Scenario
Trigger
Likely Outcome
Invalidation Point
Resistance breakout
Close above $7.4843
Push toward $9.0025
Rejection back below $6.4535
Support hold
Bounce from $5.8228
Range continues toward resistance
Close below $5.8228
Support breakdown
Close below $5.8228
Slide toward $5.0122
Reclaim of $5.8228
Can UNI Reach $12.0060?
$12.0060 is the highest resistance marked on the chart, where the chart's long-term converging trendlines also meet.
Getting there would require UNI to first clear $7.4843, then $9.0025 and $10.0547 in turn, a multi-stage move rather than a single leg.
Uniswap Price Prediction 2026: Expert View
According to CoinGabbar analysts, fresh swap demand and a strong RSI reading are driving UNI's current rally, but the Robinhood-dependency argument is a real structural risk worth watching regardless of where price sits technically.
The $5.8228 to $7.4843 zone is the range that matters most this week.
Disclaimer
This piece is for informational purposes only and isn't financial advice. The levels and scenarios above are based on technical chart analysis and publicly available data at the time of writing, and crypto markets can move sharply within hours, so past patterns don't guarantee future outcomes. It's worth doing independent research and considering your own risk tolerance before acting on any of the levels discussed here.