A large holder reportedly put $24.2M into Uniswap a week ago, and the position is already in profit. UNI now trades near $9.25 after a 2.5% gain on the latest candle. Is the next wave startin
A large holder reportedly put $24.2M into Uniswap a week ago, and the position is already in profit. UNI now trades near $9.25 after a 2.5% gain on the latest candle.
Is the next wave starting? This Uniswap price prediction covers the levels that decide it.
Uniswap News: Whale Rotates From ETH Into $UNI
The X account Whale Factor reported that a whale sold 167,855 ETH, worth about $408M, and moved part of the money into UNI. A whale is a large holder whose trades can move prices.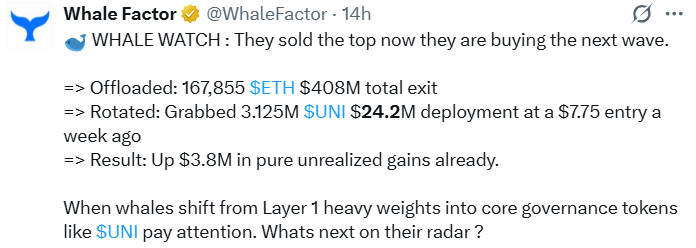
The post says the whale bought 3.125M UNI, a $24.2M deployment, at a $7.75 entry about a week ago. It puts the unrealized gains at $3.8M. Unrealized gains are paper profits that are not locked in until the holder sells.
The post links to an Arkham Explorer page. CoinGabbar could not independently verify these figures. The reported $7.75 entry is also below the lowest price on the 4H chart for the past week, and CoinGabbar could not explain the gap.
Uniswap Accumulation Signal: Trader Says Buyers Are Building
A trader on X says UNI shows a strong accumulation signal. Accumulation means buyers slowly add to their holdings, usually while the price moves sideways.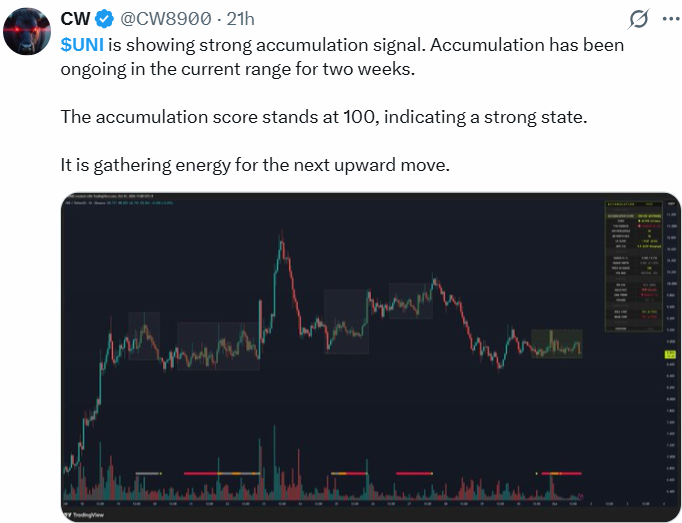
The post says this has gone on in the current range for two weeks. It also says the accumulation score is 100, which it calls a strong state, and that UNI is building up for the next upward move.
The score comes from a custom indicator shown in the post. CoinGabbar could not verify how it is calculated.
Uniswap Price Today: Technical Analysis
UNI peaked inside the red zone below $11.0174 around September 23. Since then, the price has made lower highs along a falling trendline. It dropped to the green support zone near $8.5506 in late September, then moved sideways.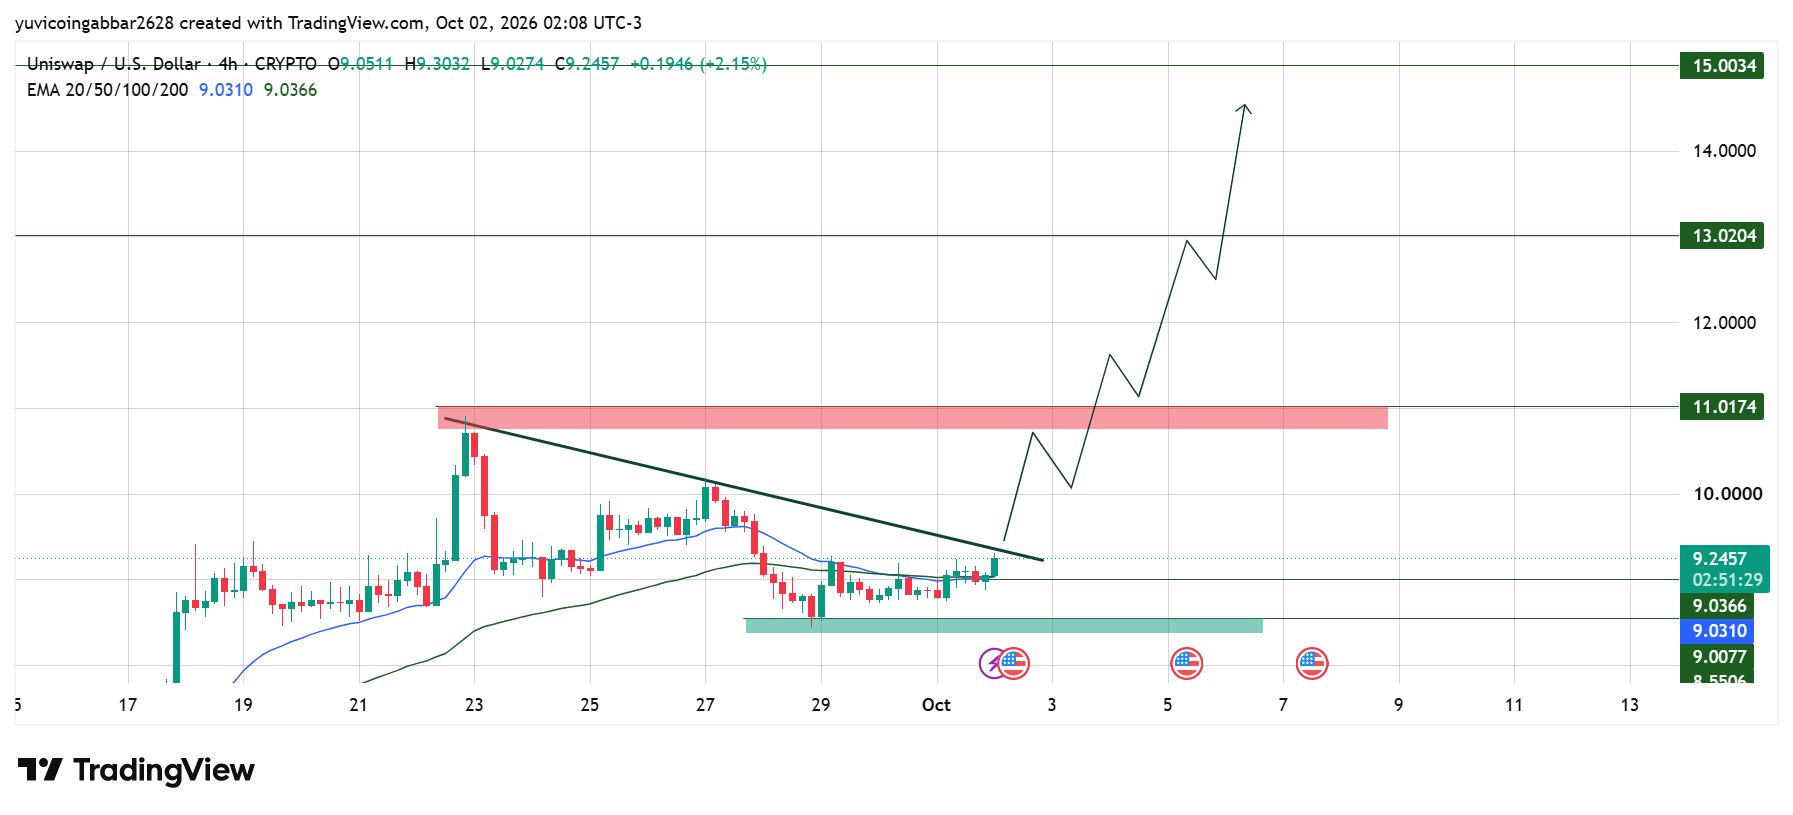
Uniswap price today now sits at $9.2457 up 2.5%, above both moving averages. The 20 EMA is at $9.0310 and the 50 EMA at $9.0366. The current candle is pressing into the falling trendline, but it has not closed above it yet.
Uniswap Price Forecast: Support and Resistance Levels
Level Type
Price
Resistance 3
$15.0034
Resistance 2
$13.0204
Resistance 1
$11.0174
Current Price
$9.2457
Deeper Support
$8.5506
Uniswap Outlook
Bull case: A close above the falling trendline would end the run of lower highs and open the way toward the red zone at $11.0174. The EMA zone below would then act as support, and the reported whale buying gives a possible reason for the demand.
Bear case: If the trendline rejects price again and $UNI closes below $9.0310, the sideways range would start to fail. The chart then points back toward the green zone near $8.5506.
Uniswap price prediction: Can $UNI Reach $15?
The $15.0034 level is the highest line on the chart. To get there, $UNI must first close above the falling trendline. After that it needs to clear the red zone at $11.0174 and then $13.0204.
Each of these levels would need to hold on close, so $15 is a multi-step move rather than a quick one.
Uniswap price prediction 2026: Expert View
According to CoinGabbar analysts, $UNI has moved from below its EMAs to above them, which shifts the focus to the trendline overhead. The next few 4H closes near that line will show whether buyers can follow through.
Watch also for whether the whale and accumulation claims show up in steady buying rather than a single spike.
Disclaimer
This piece is for informational purposes only and isn't financial advice. The levels and scenarios above are based on technical chart analysis and publicly available data at the time of writing. Crypto markets can move sharply within hours, so past patterns don't guarantee future outcomes. Do your own research and consider your risk tolerance before acting on any level discussed here.