There is a new name pulling eyeballs across the altcoin market this week. This UP price prediction looks at why a token that barely traded above five cents days ago is now fighting to hold ab
There is a new name pulling eyeballs across the altcoin market this week. This UP price prediction looks at why a token that barely traded above five cents days ago is now fighting to hold above fourteen. Was this just noise, or is something bigger building underneath?
UP Coin Rallies Hard: What Is Actually Driving This Move Today
Prices don't jump 150% for no reason, and UP just did exactly that. Something shifted in how traders are pricing this token, and broader risk appetite shown on theFear and Greed Index has stayed warm enough to support that kind of move.
Turns out the move lines up almost perfectly with a wave of activity around the project itself. New liquidity incentives went live, a major routing integration landed, and the timing was tight enough that it's hard to call it a coincidence.
We pulled up the chart expecting a slow grind. Instead, we found a token that broke a multi-day trendline and never really looked back. That's rare.
Basically, the fundamentals and the chart are telling the same story right now. That's rare in small cap DeFi tokens.
What happens next depends on whether buyers can defend the ground they just took.
KEY TAKEAWAYS
Direction: Short-term bias remains bullish after the descending channel breakout.
Reason: New liquidity pools and a routing integration triggered fresh demand.
Short-term range: Roughly $0.093 to $0.161 over the coming days.
Invalidation: A close below $0.0442 would flip the setup bearish.
UP Coin Overview: Key Numbers Every Trader Should Know TodayMetricDetailCoin NameUPTicker SymbolUPBlockchainRobinhood Chain (Arbitrum Nitro-based Ethereum Layer 2)Today High$0.1588Today Low$0.05598RSI Level64.66 (1H)Token TypeUtility and Governance TokenToken CategoryDeFi, Decentralized ExchangeMarket Cap$70.52 Million24H Trading Volume$611,178Circulating Supply500,000,000 UP24H Change+151.9%
Source: Data by CoinGecko
What Is UP Coin: A Simple Breakdown For New Readers
UP is the native token of up., a decentralized exchange and liquidity marketplace built on Robinhood Chain. According to theUP token pool page on Uniswap, the protocol runs a vote escrow ve(3,3) model based on Velodrome v2 and Slipstream designs. It launched recently and has already drawn attention for being one of the first DEX tokens native to Robinhood's own chain.
Why UP Price Jumped Over 150% In A Single Trading Day
UP touched an all-time high of $0.1588 earlier today before cooling off slightly. As per theUP coin page on CoinGecko, that high came just about two hours after the all-time low of $0.05208 was set only a day earlier.
That range in barely 24 hours means volatility is extreme, and early liquidity is thin, a pattern common amongnew token launches. Small trades can move this chart a lot.
Why This Coin Matters Now Beyond Just The Chart Move
This is not a token running on hype alone. According to0x's own announcement, up pools are now integrated with 0x Project routes across Robinhood, giving the token real distribution inside a major trading app.
On top of that, the project's official X account also announced its Epoch One liquidity round is live, offering triple-digit APR on WETH and USDG pairs to pull in fresh liquidity, an event now showing up on trackers like thecrypto events calendar. 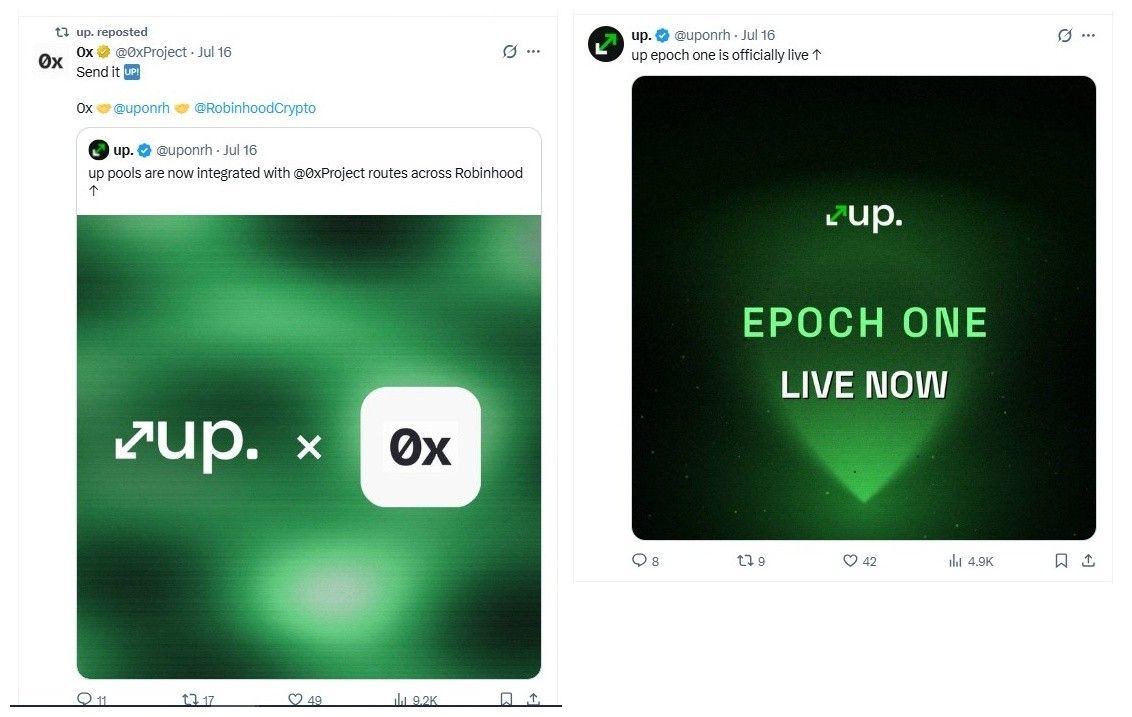
Source: Official X Account (@uponrh, @0xProject)
Basically, the team is actively building incentives right when demand is already hot, and that combination usually keeps momentum alive a little longer.
Fundamental Analysis: Supply, Holders, and On-Chain Activity
According to Robinhood Chain's own explorer, UP has 578 holders and 19,812 transfers since launch. Source: Robinhood Chain Explorer. That's an early stage holder base, nowhere near theweekly active addresses growth seen on larger chains, which explains the sharp swings.
Circulating supply sits at 500 million tokens against a total supply just above 510 million, according to CoinGecko. As an ERC-20 token tied to the broaderEthereum ecosystem through Robinhood Chain, there is not much supply overhang left to worry about right now.
$UP Technical Analysis
The move higher did not start with the chart. It started with the liquidity news, and the chart simply caught up after. According to theUP/USD chart on GeckoTerminal, UP had spent nearly a week trapped inside a descending channel on the 1-hour timeframe before finally breaking above it. 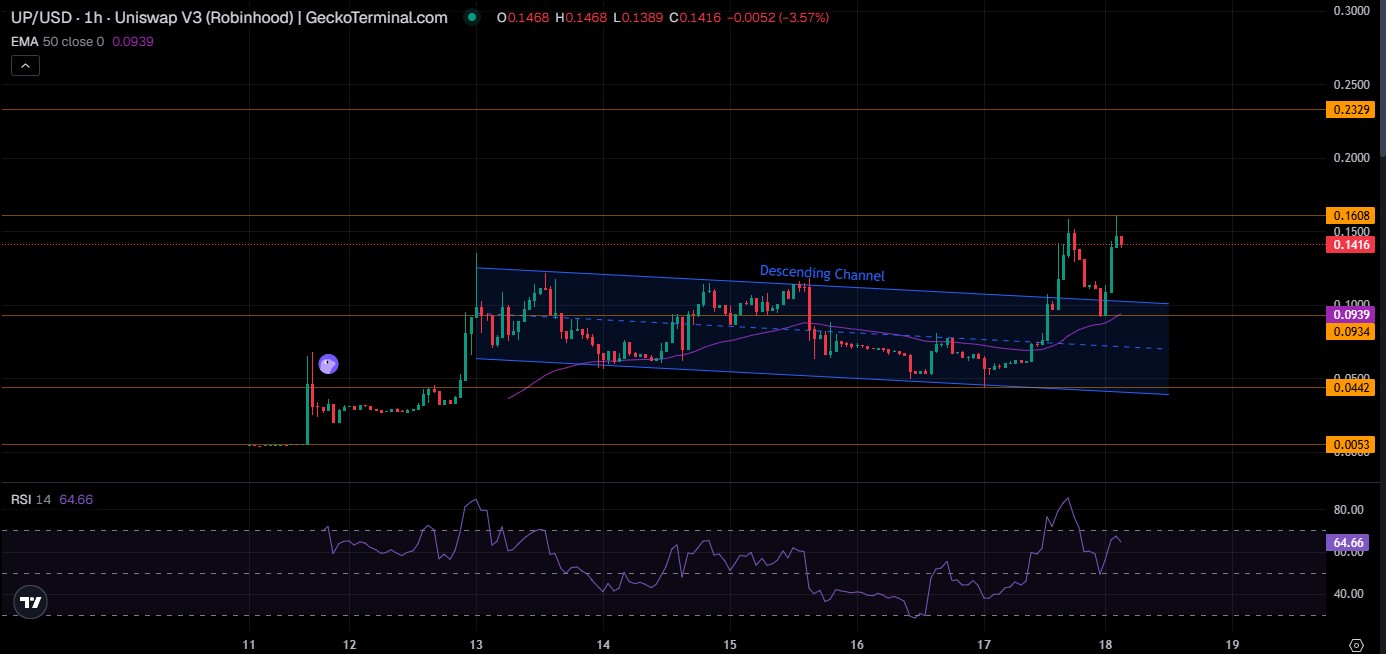
Source: Charts by Gecko Terminal
Price is trading above its 50 EMA at $0.0939, and that gap between price and average is wide. RSI sits at 64.66, firmly bullish without being extreme yet. Structure flipped the moment $0.0934 was reclaimed as support instead of resistance.
Key resistance now sits at $0.1608, with the $0.2121 Fibonacci extension as the next real target. Rejections at hard resistance are common early on, the same way aresistance level rejection recently stalled XRP before it found footing.
Support has moved up to the $0.0934 to $0.0924 zone. A clean hold above $0.14 keeps the breakout intact. Losing $0.0934 on strong volume would be the first real warning sign.
UP Versus Other Robinhood Chain And DEX Tokens Right Now
Compared to older ve(3,3)-style tokens on establishedDEX exchanges, UP moves with far more volatility simply because it's new and thinly traded. Price discovery here is still far from settled.
UP Short Term Price Prediction: Where It Could Head Next Week
The next few days likely hinge on whether buyers defend the $0.093 zone. Here is how the range could play out.
TimeframeBearish FibBearish TargetBullish FibBase TargetBullish TargetInvalidation24 Hours0.786$0.12071.272$0.1523$0.1664Close below key support3–7 Days0.618$0.09241.618$0.2121$0.2860Lose swing low2–4 Weeks0.500$0.04422.618$0.2860$0.4057Weekly close below support
Source: Gecko Terminal (4H) | Trend-Based Fibonacci Extension | Market Structure
Watch the $0.093 zone above everything else this week.
UP Long-Term Price Prediction: Where It Could Trade By 2027
Zooming out, the case here depends on whether Robinhood Chain actually pulls in sustained trading volume, not just launch week hype, the same test that shapes most long-termcrypto price predictions for new chains.
TimeframeBearish FibBearish TargetBullish FibBase TargetBullish TargetCatalyst Needed3 Months0.786$0.08371.272$0.2062$0.2500Hold weekly support and rising volume6 Months0.618$0.04581.618$0.2062$0.3054Ecosystem growth and sustained demandEnd of Year0.500$0.04582.618$0.3054$0.4658Break above major weekly resistance2027 Outlook0.382$0.05004.236$0.4658$0.7253New ATH, adoption and a crypto bull market
Source: Gecko Terminal (Weekly) | Trend-Based Fibonacci Extension | Macro Trend Analysis
The long-term case is speculative but not weak. It leans heavily on Robinhood Chain adoption actually following through.
Three UP Price Scenarios Traders Should Prepare For
Worst Case: Liquidity dries up once Epoch One incentives fade, and early holders take profit into thin air.
Base Case:UP consolidates between $0.09 and $0.16 while Robinhood Chain volume slowly builds week over week.
Best Case: More routing integrations land, holder count climbs fast, and price pushes toward the $0.21 fib extension zone.
ScenarioPrice RangeWhat Triggers ItWorst Case$0.044–$0.093Incentive fade, thin liquidity exitBase Case$0.093–$0.161Steady chain adoption, range-bound tradingBest Case$0.161–$0.286New integrations, holder growth, volume surgeKey UP Price Levels Every Trader Is Watching This Week
Resistance zone:$0.1608 up to $0.2121, the next major Fibonacci target if buyers keep control.
Support zone:$0.0934 down to $0.0924, the exact area where the channel breakout occurred.
Invalidation zone: Below $0.0442, a level that would undo the entire bullish structure.
UP Analyst View And Final Thoughts On The Current Setup
The setup looks more bullish than most casual observers are giving it credit for right now.
Price reclaimed a multi-day descending channel, RSI is healthy without being overbought, and the gap between price and the 50 EMA usually signals trend strength, not exhaustion.
A weekly close above $0.14 would go a long way toward confirming this was not just a liquidity-driven spike, the kind of follow-through recently seen inUniswap fee buybacks once real usage kicked in.
One thing worth tracking outside the chart: how sticky the new Epoch One liquidity event actually is once the promotional APR normalizes.
The $0.093 support zone remains the single most important level on this chart right now.
That's the whole picture in one line: breakout confirmed, follow through still unproven.
Risk Factors Traders Should Not Ignore
Liquidity risk: Thin order books mean large trades can swing price sharply in either direction.
Volatility risk: A 24-hour range this wide can reverse just as fast as it formed.
Thesis breaker: A close below $0.0442 or a drop in holder growth would undercut the bullish case.
Disclaimer
This article is for educational purposes only and does not constitute financial advice. Crypto markets are volatile. Consult your investment advisor before making any investment decision.