VeChain Price Prediction: Is VET's Rally Already Losing Steam? Something shifted for $VET in the last two days, and it's the first thing this VeChain price prediction needs to unpack. The tok
VeChain Price Prediction: Is VET's Rally Already Losing Steam?
Something shifted for $VET in the last two days, and it's the first thing this VeChain price prediction needs to unpack. The token that broke out of a months-long slump is suddenly giving part of it back, tied to the Fed and thin liquidity amplifying every move. So what actually changed?
Why Is VeChain Price Falling Today?
$VET dropped almost 5% in the past day, and it's not really about $VET at all. Bitcoin fell around 3% ahead of Fed Chair Kevin Warsh's Jackson Hole speech on August 28. VET had just run up hard, and overbought conditions plus a sudden 68% drop in volume did the rest.
This isn't VeChain-specific; it's a market-wide flinch. But thin liquidity means small sells create outsized red candles. Broadercrypto market sentiment still leans cautious.
VeChain Price Snapshot (as of 17:00 UTC, August 29, 2026)
Themonthly price analysis tracks this same setup week by week.
Price: $0.006639, down 4.61% in 24 hours
Market cap: $570.86M
24h volume: $27.39M, down 69.04%
Circulating supply: 85.98B VET of an 86.71B max supply
All-time high: $0.2782, down 97.61% from that peak
All-time low: $0.001678
Data via CoinMarketCap. Still deep below its 2021 top, yet up roughly 295% off its all-time low.
VeChain Technical Analysis: Daily and Weekly Chart Breakdown
Daily Chart Analysis
The daily TradingView chart shows VET breaking out of a descending triangle in late August. 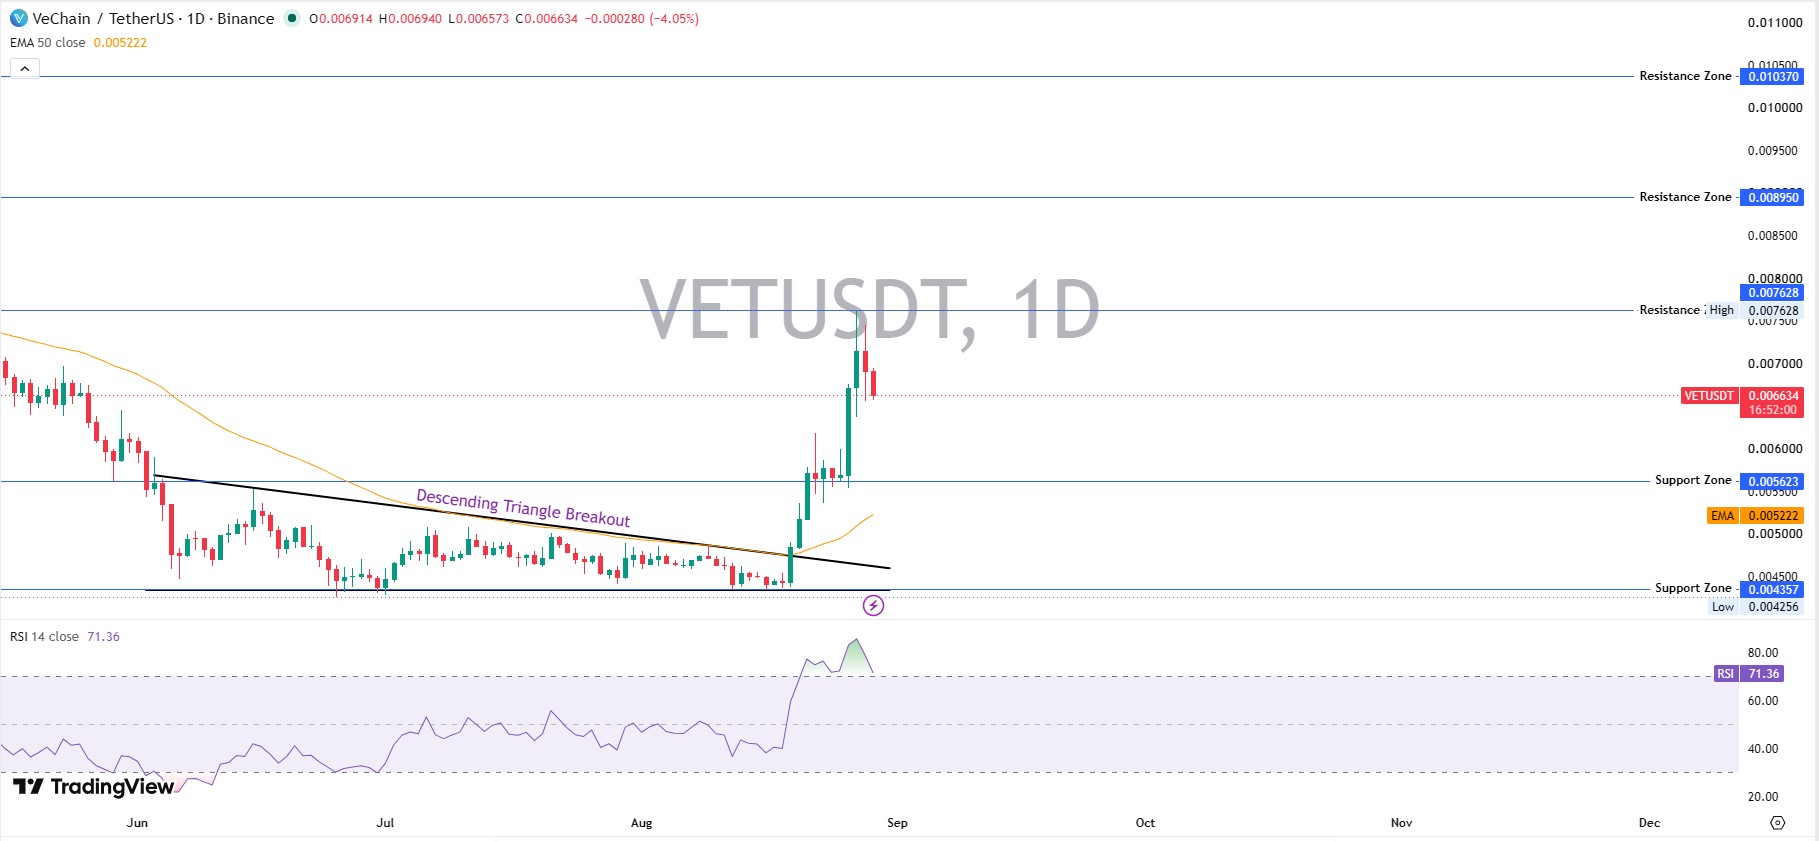
That breakout pushed trading well above the 50 EMA near $0.005222, and RSI spiked to 71.36, deep into overbought territory. And that's exactly where the pullback started.
We watched the rejection happen right near $0.007628, a prior resistance high. Momentum got ahead of itself. The retreat looks like digestion, not a reversal, but it needs to hold $0.005623 to keep the structure intact. Similar setups get covered in thisprice prediction section.
Weekly Chart Analysis
Zoom out and the picture is more sobering. VET's been stuck under a multi-year descending trendline since the 2024 high near $0.08, with lower highs at $0.0269, then $0.0132. 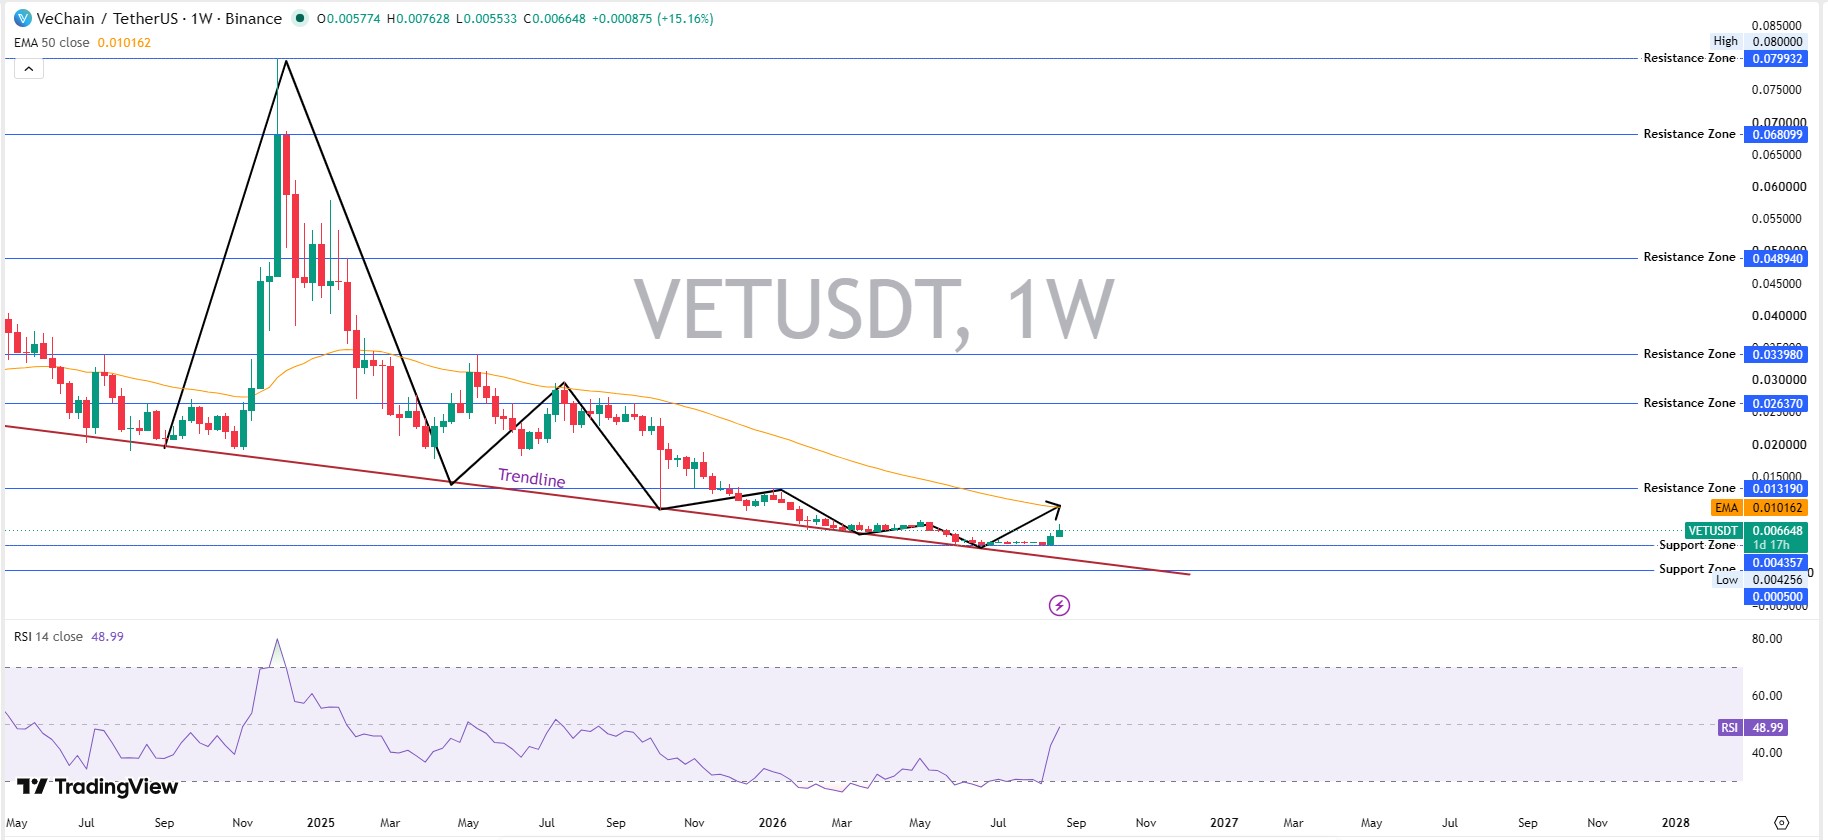
TheAugust price prediction flagged this exact trendline weeks ago. Weekly RSI at 48.99 says the bounce hasn't confirmed a real trend shift yet.
Turns out, this breakout is testing that trendline right now. A weekly trade above it matters more than any daily candle.
VET Support and Resistance Levels
Key support sits at $0.005623, with a deeper floor at $0.004357. Resistance stacks at $0.007628, then $0.008950, then $0.010370, lining up with the weekly EMA 50 near $0.010162. Sustained trading through that cluster would shift theVeChain price outlook toward something stronger.
VeChain Price Prediction: Bear, Base, and Bull Scenarios
Timeframe
Bear Case
Base Case
Bull Case
Probability
Invalidation
7 Days
$0.0059
$0.0064 – $0.0068
$0.0072 – $0.0076
Bear 25% / Base 50% / Bull 25%
Sustained trading below $0.0059
30 Days
$0.0052 – $0.0056
$0.0066 – $0.0075
$0.0085 – $0.0095
Bear 25% / Base 45% / Bull 30%
Weekly trade below $0.0052
Early 2027
$0.0045 – $0.0055
$0.0075 – $0.0095
$0.0120 – $0.0150
Bear 20% / Base 45% / Bull 35%
Failure to reclaim the $0.0102 EMA zone
This VeChain price prediction isn't a promise; it's a probability map built off current structure, and structures break.
VeChain's Position in the Altcoin Market
VET trades as a large-cap altcoin, meaning it's a token outside Bitcoin and Ethereum with its own use case rather than a copy-paste speculative asset. VeChain's angle is enterprise blockchain and supply-chain tracking, not quick hype. That distinction matters because altcoins tied to real infrastructure tend to react differently to macro shocks than pure momentum plays do.
Liquidations and Exchange Activity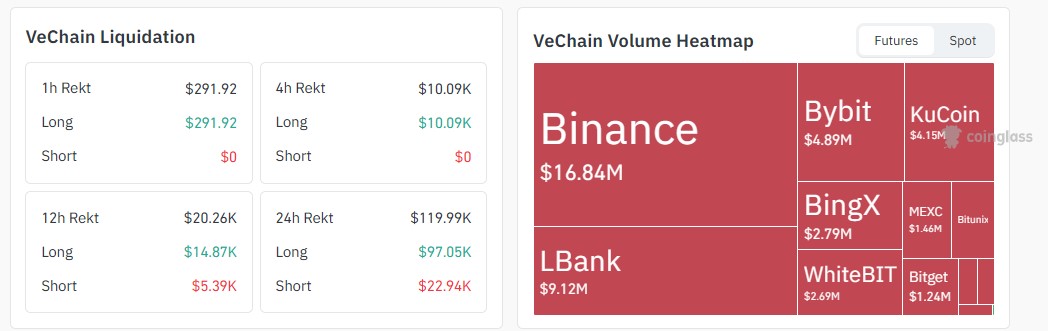
The dip wasn't gentle for leveraged traders. According to CoinGlass, liquidations over the past 24 hours hit $119.99K, split $97.05K long against just $22.94K short, so longs absorbed almost all of the damage.
Trading activity is spread across several venues rather than concentrated in one place. Binance alone carried $16.84M of it, and the rest is visible throughexchange listing data if you want the full breakdown by platform.
VIP-255 and the Push Into AI Agents
Separate from the price action, $VET recently detailed VIP-255, its Interstellar upgrade. It's set to go live near Block Height 25,902,540 on September 16, 2026.
Alongside that, $VET is pushing into AI agent infrastructure through VeWorld. Neither development stops a macro-driven red day. But together they separate VeChain's altcoin thesis from tokens running on hype alone. Read the technical breakdown straight fromVeChain on X.
What Could Invalidate This VeChain Price Prediction?
A daily trade back below $0.005623 would undo the breakout. A broader Bitcoin leg down, especially anything tied to freshmacro or regulatory news, would drag VET along regardless of fundamentals. A failed retest of the trendline confirms this was just another lower high.
Geopolitical friction is another wildcard, tracked here viabroader crypto news, since risk-off moves rarely stay contained.
Conclusion
VET just proved it can break a months-old triangle. It also proved macro headwinds don't care about chart patterns. This VeChain price prediction leans cautiously constructive, not because everything's clean but because support has held and fundamentals haven't cracked.
Watch $0.0059. Watch the weekly trendline. Everything else is noise.
For what else is moving today, check thelatest crypto market news.
Disclaimer
This article is for informational purposes only and does not constitute financial, investment, or trading advice. Cryptocurrency markets are highly volatile, and prices can change rapidly. Always do your own research and consult a licensed financial advisor before making any investment decisions.