Velvet price prediction is suddenly the phrase everyone in the small-cap crypto corner is typing into search bars this week. $VELVET went from a quiet, mostly ignored ticker to one of the lou
Velvet price prediction is suddenly the phrase everyone in the small-cap crypto corner is typing into search bars this week. $VELVET went from a quiet, mostly ignored ticker to one of the loudest movers on the board, and traders who missed the early move are now asking whether they are already too late. Something changed in how people are looking at this coin, and it did not happen overnight in the way it looks on the chart.
Why Is Everyone Suddenly Talking About Velvet Coin Today
VELVET did not just tick up. It ripped. A coin that most people had never heard of a month ago is now sitting near the top of trending lists, and that kind of attention rarely shows up without a reason.
Turns out, the story behind this move is not just chart noise. Some of the earlier coverage of theVelvetX Robinhood Chain rally already flagged this kind of momentum building, and this week's action looks like a continuation of that same push.
Basically, you've got a low-float coin, heavy exchange volume, and a community that is actively pushing new features. That combination can create fast gains. It can also create fast reversals.
So the real question is not whether $VELVET moved. Everyone can see that. The real question is whether this move has legs or whether it is the kind of spike that fades once the excitement cools off.
Coin Overview: How Does $VELVET Look Right Now
MetricDetailCoin NameVelvetTicker SymbolVELVETBlockchainBNB Smart Chain (BEP-20)Today High$0.6278Today Low$0.4334RSI Level61.53Token TypeUtility / DeFiToken CategoryAI Trading and Perpetuals PlatformMarket Cap$263.97M24H Trading Volume$27.4M24H Trading Volume Change+200.76%Circulating Supply421.06M VELVET24H Change+42.29%
Source: Data by CoinMarketCap
What Exactly Is The Velvet Token Built To Do
Velvet runs on the BNB Smart Chain and positions itself as an AI-powered trading and social platform, not just another meme-style ticker. The project launched its perp trading tools recently, letting users go long or short on other tokens directly through the platform.
People care about it because it blends social trading with AI tools, and because the recent price action has pulled in a wave of new eyes that were not watching this coin a month ago.
Velvet Price History and How Far It Has Traveled
The all-time high for $VELVET sits at $2.09, reached on June 29, 2026, just fourteen days ago. From there, the price fell hard, down nearly 70% from that peak before this week's bounce.
And on the other end, the all-time low was $0.03206 back on July 10, 2025. From that low point, $VELVET is still up over 1,800%, which tells you this token has already been through more than one full cycle of hype and correction.
Source: Data by CoinMarketCap
Why This Coin Matters Now Beyond The Price Chart
Velvet is not sitting still on the product side. The platform just went live with perps trading on a new token called CashCat, offering up to three times leverage through tools powered by Hyperliquid.
We pulled up the official Velvet account on X, and the messaging is clear: the team wants active traders using its perps and social tools daily, and it is dangling gems and an August 10th VELVET airdrop as the incentive to keep people trading.
Velvet Team Teases New Perps Product And August Airdrop
Now live: perps trading with up to three times leverage on CashCat, all powered by Hyperliquid through the Velvet platform. The post frames it as a way to trade smarter using AI and social tools, and every trade earns gems that count toward an allocation in the August 10th VELVET airdrop.
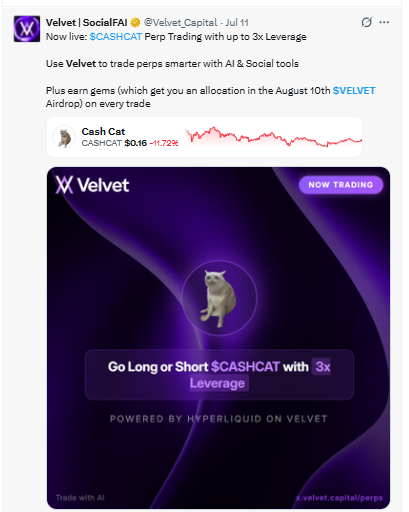
Source: Posted on X by Velvet Capital, "Now live: $CASHCAT Perp Trading with up to 3x leverage."
Velvet Liquidation Data Shows Shorts Are Getting Squeezed
The liquidation numbers tell a rough story for anyone betting against VELVET this week. In the past 24 hours, $473.96K in positions got wiped out, and short sellers took the bigger hit at $283.40K compared to $190.56K in long liquidations.
Zoom into the 1-hour window, and it's even more one-sided: $73.24K in short liquidations against just $778 in longs. Shorts have been getting run over repeatedly as the price keeps climbing.
Source: Liquidation data by CoinGlass
Fundamental Analysis: What Is Actually Backing This Move
Here's the thing: VELVET's fundamentals are a mixed bag. On one side, the platform has real usage, a live perps product, and a growing holder count that ticked up to over 16,000 wallets.
On the other side, the holder concentration is extreme. Top 100 wallets control 99.81% of supply, and the top five addresses alone hold roughly 81% of everything in circulation. A Gini score of 0.9994 confirms just how top-heavy this distribution really is.
That does not automatically mean bad news. But it does mean price can swing hard in either direction if even one or two large wallets decide to move. something worth weighing alongside any breakdown ofwhy VELVET is surging before treating this move as a sure thing.
VELVET Technical Price Analysis: Reading The VELVET Chart Right Now
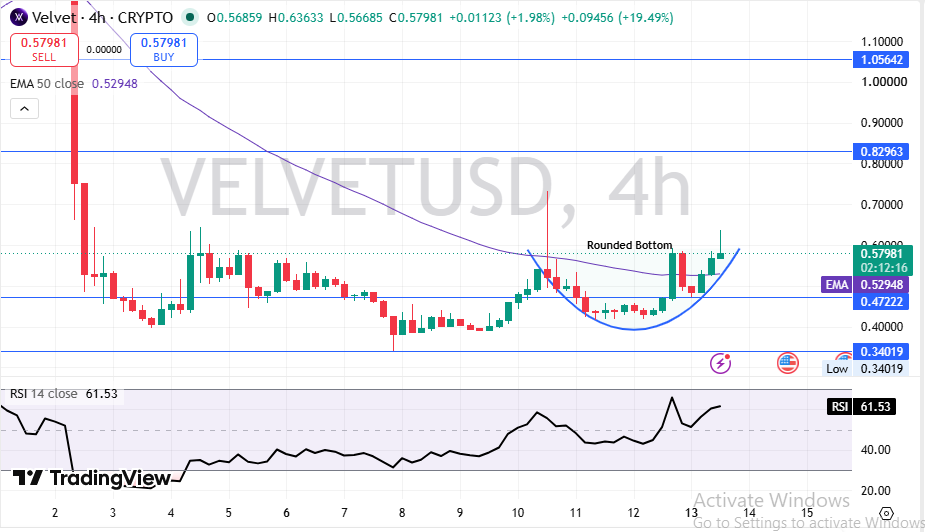
Price did not just bounce randomly. It spent weeks carving out a rounded bottom pattern on the 4-hour chart, the kind of slow, grinding base that often precedes a bigger move once buyers finally step back in.
Source: Charting by TradingView
VELVET is currently trading at $0.57981, sitting above its 50 EMA of $0.52948. That's a meaningful shift. Buyers have been in control since the base completed, and the RSI at 61.53 backs that up without flashing overbought yet.
Support sits at $0.47222, with a deeper floor at $0.34019 marking the invalidation zone for this entire bullish structure.
Resistance stacks up at $0.82963 first, then $1.05642 above that.
A confirmed close above $0.82963 on strong volume would likely open the door toward that next resistance zone. Fail there, and some consolidation or profit taking looks likely before the next real move.
Volume Heatmap Shows Where The Real Trading Is Happening
Binance is dominating VELVET volume by a wide margin, handling $149.02M of activity. MEXC follows at $28.89M, with Bybit and Bitget both sitting around the $21M mark.
That kind of concentration on major exchanges usually means liquidity is deep enough to absorb large orders without wild slippage, which matters for anyone actually trying to trade this thing.
Source: Volume heatmap by CoinGlass
Short-Term Velvet Price Prediction For The Coming Weeks
Over the next few weeks, VELVET's path likely depends on whether it can clear resistance with real volume behind it or whether the rally starts running out of new buyers.
TimeframeBearish TargetBase TargetBullish TargetKey Trigger24 Hours$0.52$0.60$0.68Whether price holds above the 50 EMA3–7 Days$0.47$0.65$0.83A volume-backed breakout past resistance2–4 Weeks$0.40$0.72$1.05Continued airdrop hype and new listings
Watch the $0.47222 support zone closely. Lose it, and the short-term bullish case weakens fast.
Long-Term Velvet Price Prediction Through 2027
Looking further out, VELVET's long-term case depends less on chart patterns and more on whether the platform keeps building real trading volume beyond this current wave of attention.
TimeframeBearish TargetBase TargetBullish TargetCatalyst Needed3 Months$0.25$0.55$0.95Sustained perpetual trading volume growth6 Months$0.18$0.60$1.30New exchange listings and airdrop follow-throughEnd of Year$0.15$0.70$1.75Broader altcoin market recovery2027 Outlook$0.10$0.85$2.10Platform expansion beyond the current token base
The long-term case here is honestly not strong yet. It's speculative, and it leans heavily on continued marketing momentum rather than proven, sticky user demand.
Three Price Scenarios Traders Should Prepare For
Worst Case: A handful of top holders start distributing their strength, breaking support at $0.34019 and unwinding most of this week's gains.
Base Case: Price consolidates between $0.47 and $0.83 for a few weeks while the market digests the recent move and watches the August airdrop unfold.
Best Case: Volume stays strong, resistance at $0.82963 breaks cleanly, and price pushes toward $1.05642 as new users pile into the perps platform.
ScenarioPrice RangeWhat Triggers ItWorst Case$0.20 - $0.34Whale distribution and a breakdown below key support levels.Base Case$0.47 - $0.83Sideways consolidation with range-bound trading.Best Case$0.83 - $1.30A volume-backed breakout above major resistance.Key Price Levels To Watch Before Your Next Trade
Resistance zone:$0.82963 first, then $1.05642. A close above the first level on strong volume would be the clearest bullish signal on this chart.
Support zone:$0.47222. This is the level buyers have defended so far during the rounded bottom formation.
Invalidation zone:$0.34019. A confirmed close below this level would break the current bullish structure entirely.
Analyst View And Final Thoughts On The Velvet Rally
When we pulled up the RSI on this chart, the first thing that stood out was how much room is still left before overbought territory. At 61.53, there's still space for this move to extend.
The rounded bottom pattern is textbook in shape, and price holding above the 50 EMA since the breakout is a real signal that buyers are still active, not just a one-day spike.
But the concentration data cannot be ignored. With five wallets holding roughly 81% of the supply, this chart can move on decisions made by just a few addresses, not broad market demand.
One external factor worth tracking beyond the chart itself is the August 10th airdrop. That date could pull in fresh trading volume, or it could trigger selling once early participants get their allocation.
The most important level on this entire chart remains $0.47222. Hold it, and the bullish rounded bottom stays intact. Lose it, and this whole setup needs a rethink.
Risk is still real here. Trade the range, not the hype.
Disclaimer: This article is for educational purposes only and does not constitute financial advice. Crypto markets are volatile. Consult your investment advisor before making any investment decision.