Solana is heading into September at $103.39, almost unchanged on the day as traders digest a volatile August. SOL began the month near $75 before climbing toward $110, then pulled back and fo
Solana is heading into September at $103.39, almost unchanged on the day as traders digest a volatile August. SOL began the month near $75 before climbing toward $110, then pulled back and found buyers above the $100 psychological level.
That leaves the SOL price at a key technical crossroads, with $105–$107 acting as the first resistance zone and $95–$97 as nearby support.
The fundamental picture has also improved. U.S. spot Solana ETFs have attracted about $1.34 billion in cumulative net inflows, Bitwise’s BSOL has passed $1 billion in assets, and Solana validators approved faster disinflation that could cut projected issuance by 18.9 million SOL over six years. September could decide whether SOL extends its recovery or gives back part of August’s gains.
September Has Several Catalysts for SOL
The first major event is the September 15 Senate procedural vote on the CLARITY Act. The vote is a cloture test on whether the Senate can advance H.R. 3633, and it requires 60 votes. The bill would establish clearer boundaries between digital commodities and securities, with the CFTC and SEC receiving defined areas of authority.
For Solana, that vote matters because clearer rules could make life easier for crypto companies and funds in the U.S. But don’t treat it as an automatic green light for SOL. September 15 is just a procedural vote, not the final pass, and there are still disagreements that need sorting out.
The more direct fuel right now is ETF demand. U.S. spot Solana ETFs pulled in $60.91 million on August 27 alone, the biggest single-day inflow of 2026. That brought total inflows to about $1.32 billion. By August 28, that number ticked up to roughly $1.34 billion, with BSOL alone crossing $1.02 billion.
On top of that, the Solana price rallied about 46% in August. So it’s heading into September with a pretty solid foundation.
There is also a supply-side development. Solana’s SGP-0002 governance proposal passed with 67.001% support, clearing the 66.67% requirement. The change doubles the annual disinflation rate from 15% to 30%, bringing the network toward its existing 1.5% terminal inflation rate in about 2.8 years instead of 5.7 years. The proposal estimates approximately 18.9 million fewer SOL emissions over six years.
What Is the Solana Chart Showing?
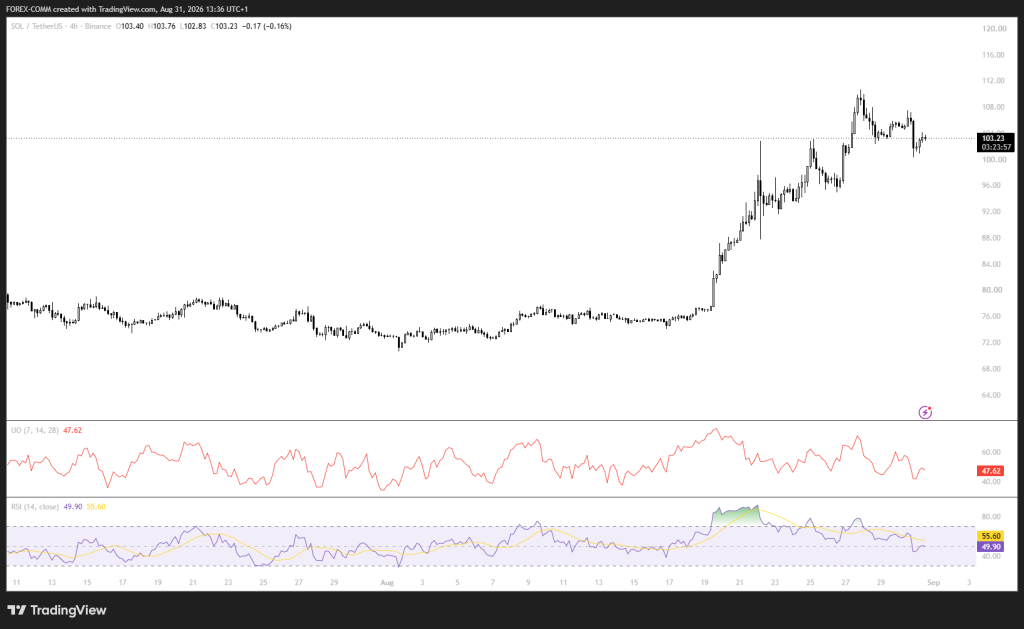
We had a look at the chart, and the first thing that stands out is the size of the August recovery. The SOL price moved from the low-$70s into the $100 area, then reached roughly $110–$111 before retreating toward $103. The price is now consolidating above $100 rather than breaking back into the previous $90s range.
 Source: Tradingview.com
The $105–$107 zone is the first major test. A move through this region would put the recent peak around $110–$112 back into view, with $115 as the next psychological resistance. On the downside, $100 is the immediate support. If that level fails, the next area to watch is $96–$97, followed by roughly $92–$94.
The momentum indicators are more neutral than bullish. The RSI is 49.90, below the 50 midpoint and below its RSI moving average at 55.60. That means bullish momentum from the August rally has cooled.
The Ultimate Oscillator is 47.62, also below 50. Neither indicator shows an oversold market, so buyers still have room to defend the current level, but the chart needs a fresh move above $105–$107 to confirm renewed strength.
Related Solana News: SOL Price Could Have a New Catalyst After Solana Hits 4.2 Billion Transactions
Where Could the Solana Price Go in September?
The bullish path takes SOL from $103 toward $107, $110 and $115, with a stronger breakout potentially opening $120. Sustained ETF inflows, the tighter issuance schedule and progress on the CLARITY Act could provide the fundamental support for this move. A daily close above $110 would be the key confirmation.
The base-case path keeps the Solana price between $96 and $112. SOL could test $100 again, defend $96–$97 and then recover toward $107–$110. This scenario fits the RSI and Ultimate Oscillator readings, which show neither strong bullish nor bearish momentum.
The bearish path begins with a loss of $100. That could send SOL toward $96–$97, then $92–$94. If those levels fail, $85–$88 becomes possible. For this scenario to develop, ETF inflows would need to weaken and broader crypto risk appetite would need to deteriorate.
For September, the key level is $100. Holding it keeps $107, $110 and $115 within reach. Losing it puts $96–$97 in control. The cleanest bullish confirmation would come from a daily close above $107, opening the way toward $110 and potentially $120.
Frequently Asked Questions
Can Solana price reach $120 in September 2026
Yes. The SOL price would first need to break above the $105–$107 resistance zone and reclaim the August high near $110–$112. A sustained move above $115 could open the path toward $120.
Why is Solana’s supply reduction bullish for SOLSolana’s SGP-0002 proposal passed with 67.001% support, increasing the annual disinflation rate from 15% to 30%. The change is projected to reduce SOL emissions by about 18.9 million tokens over six years, lowering the amount of new SOL entering circulation.
Are Solana ETFs driving the SOL price higherETF demand has become an important source of buying pressure. U.S. spot Solana ETFs have recorded about $1.34 billion in cumulative net inflows, and Bitwise’s BSOL has surpassed $1 billion in assets under management. Sustained inflows could support the SOL price in September.
Subscribe to our YouTube channel for daily crypto updates, market insights, and expert analysis.
The post Where Will Solana (SOL) Price Go in September? appeared first on CaptainAltcoin.