Why Are Bitcoin, Ethereum, and XRP Prices Crashing Today? Bitcoin price today slid to $77,450.87, down 3.1% over the last 24 hours. Ethereum and XRP followed it lower. The drop came after Fed
Why Are Bitcoin, Ethereum, and XRP Prices Crashing Today?
Bitcoin price today slid to $77,450.87, down 3.1% over the last 24 hours. Ethereum and XRP followed it lower. The drop came after Fed Chair Kevin Warsh spoke at the 2026 Jackson Hole Symposium, and traders did not like his tone.
The bitcoin price today move wiped out over $400 million in leveraged positions across the crypto market. Long traders took the biggest hit.
Why is the crypto market down today?
The Bitcoin price prediction picture shifted fast this week. Bitcoin had been trying to build a base above $80,000, but that attempt failed once Warsh's comments hit the wires.
The sell-off traces back to Jackson Hole. According to CNBC, Warsh said recent PCE and CPI inflation readings came in better than expected, but he stopped short of saying the underlying inflation trend had meaningfully improved.
He did not lay out a specific rate path. Instead, Warsh called for a "quieter Fed," one that leans less on forward guidance and gives markets fewer signals to trade around.
That is a shift from his predecessors. Former Chair Jerome Powell often used rate cut expectations to calm Wall Street. Warsh appears to be taking the opposite approach on purpose.
Markets reacted anyway. Traders had been pricing in a pause for the September meeting. Any hint that easy money is not guaranteed tends to hit risk assets like crypto first.
What are the odds of a Fed rate hike in September 2026?
CME-style rate probability data shows a clear shift. The odds of the Fed holding rates steady at the September 16, 2026 meeting sit at 43%. The odds of a 25 basis point hike now sit at 57%.
The chance of a rate cut remains at zero.
Scenario
Probability
Rate Hold
43.0%
25 bps Hike
57.0%
Rate Cut
0.0%
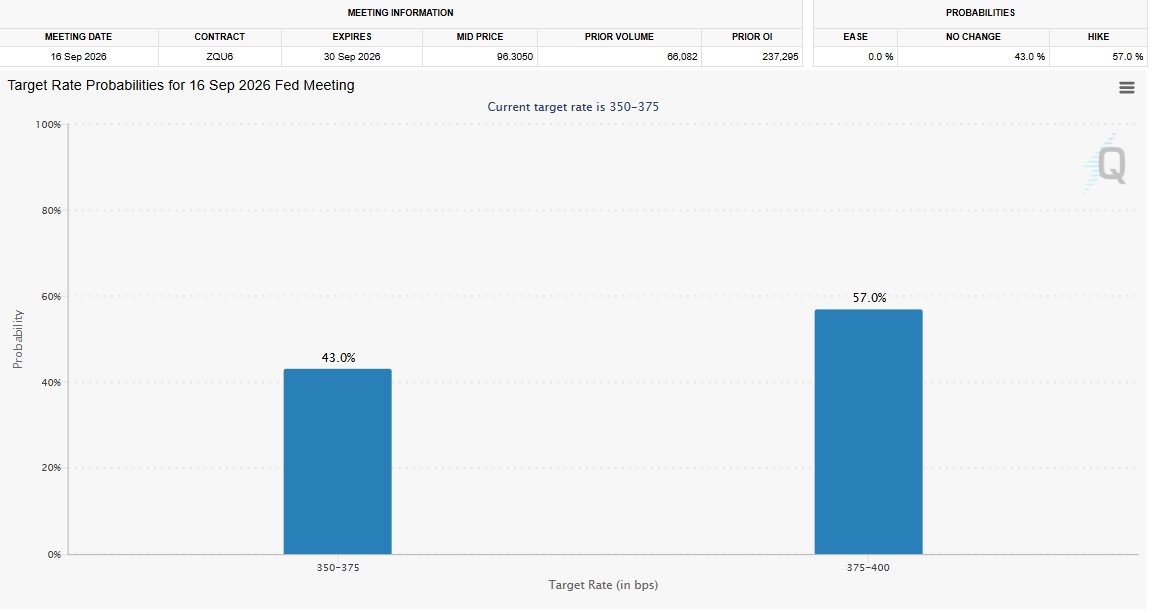
That is a meaningful swing. A market pricing in more hike risk than hold risk tends to pressure crypto, since higher rates make holding non-yielding assets like bitcoin less attractive.
How much was liquidated in crypto today?
The damage in the derivatives market was heavy. CoinGlass data shows total liquidations across the crypto market reached $405.70 million in 24 hours.
Bitcoin led with $152.54 million in liquidations. Ethereum followed at $94.33 million. Solana saw $21.13 million wiped out.
Asset
24h Liquidations
Bitcoin (BTC)
$152.54M
Ethereum (ETH)
$94.33M
Solana (SOL)
$21.13M
XRP
$13.13M
Long positions took the brunt of it, losing $330.68 million. Short sellers lost just $75.03 million.
In total, 84,454 traders got liquidated. The single largest order hit Binance's ETHUSDT pair, worth $11.66 million.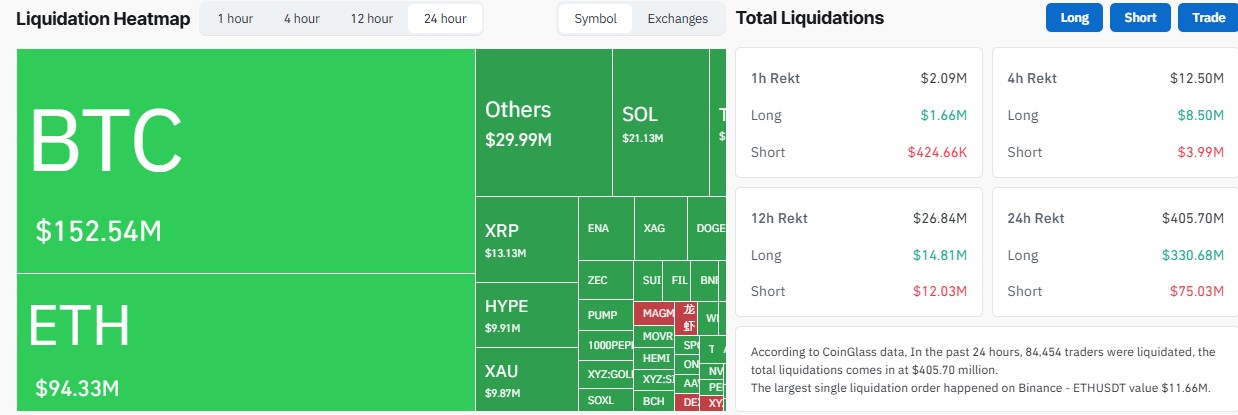
Bitcoin price prediction: what does the chart show?
The 1-hour BTC/USD chart points to a short-term bearish correction. This comes after Bitcoin failed to hold a breakout above $80,000.
Price is now trading below its 20, 50, and 100 EMAs. RSI has dropped to around 32.7, close to oversold territory.
The chart shows a rejection near $81,000, then a run of lower highs, then a sharp break through the EMA cluster. That lines up with the pullback from about $81,300 down to roughly $77,800.
Most likely near-term path for bitcoin:
$77.3K down toward $76.8K to $76.0K
Possible bounce from there
Retest of $77.8K to $78.6K
The key zone to watch is $76.8K to $77.0K. It lines up with a rising trendline and the 200 EMA on the hourly chart.
If that zone holds, a relief bounce could aim for $78.0K first, then $78.5K to $78.7K, then $79.5K to $80K, and $81K to $81.3K as a stretch target.
If bitcoin closes an hourly candle below $76.8K, the setup weakens. In that case, $75.8K to $75.0K becomes the next zone to watch, with $74K possible if selling speeds up.
XRP price prediction: Is $1.35 the key level?
XRP recently broke above its 200-day EMA near $1.35, the first time it managed that since October 2025. That move triggered a short squeeze that pushed price as high as $1.70 last week.
Since then, XRP has pulled back toward the $1.40 to $1.45 zone and now trades closer to $1.38.
Analysts see the 200-day EMA near $1.35 as the line in the sand. Holding above it keeps a move toward $1.60, then $1.80, in play. Losing it raises the odds of a deeper correction.
Some traders are looking much further out. One trader who correctly called XRP's earlier run from $0.50 to over $3.30 says XRP may be forming a bullish wedge pattern.
If that plays out, the measured move target sits near $15. That is a long-term, high-risk scenario, not a near-term call, and it depends entirely on the pattern holding.
A separate long-term Gaussian Channel model points to Fibonacci-based targets near $4.98, $8.59, and $13.89 over a multi-year horizon. These are chart-based projections, not guarantees.
Ethereum price prediction: Can ETH hold $2,400?
Ethereum has reached a level where the next move matters. After running from around $1,900 to the $2,550 area, price spent several days moving sideways near the highs.
ETH now trades back around $2,400.
As long as the $2,400 to $2,420 zone holds, the next test is a move back through $2,480 to $2,500. Above that, the real hurdle is the $2,535 to $2,555 local high.
A clean break and hold above that level would put $2,600 to $2,650 in play, followed by $2,750. If momentum keeps building, $3,000 becomes the main upside target.
Losing $2,400 changes the picture. In that case, $2,350 becomes the next level to watch.
The path from here, in short:
Hold $2,400
Reclaim $2,500
Break the local highs
Then look higher
A pullback alone would not be a red flag. The structure only weakens if buyers fail to defend the same zone that supported the latest leg up.
Bitcoin price today: key takeaway
The bitcoin price today story is really a Fed story. Warsh's Jackson Hole comments did not promise a hike, but they removed the certainty of a pause, and that was enough to spook leveraged crypto traders.
With hike odds now above hold odds for the first time in weeks, bitcoin, ethereum, and XRP all face a tougher setup heading into the September Fed meeting.
Disclaimer
This article is for informational purposes only and does not constitute financial, investment, or trading advice. Cryptocurrency prices are highly volatile, and past performance does not guarantee future results. Chart patterns, technical levels, and price targets discussed here are speculative and not guaranteed outcomes. Always do your own research and consult a licensed financial advisor before making investment decisions.