Bitcoin, Ethereum, and XRP are all climbing together on Thursday. The short answer is steady ETF inflows and improving market sentiment. Bitcoin is trading near $80,000. Ethereum sits above $
Bitcoin, Ethereum, and XRP are all climbing together on Thursday. The short answer is steady ETF inflows and improving market sentiment.
Bitcoin is trading near $80,000. Ethereum sits above $2,500. XRP is holding near its $1.40 support zone.
All three are climbing at the same time, and the data behind the move points to real money entering the market, not just hype.
Why is crypto market sentiment turning bullish this week?
The Crypto Fear & Greed Index reads 71 today. That's up from 65 the day before. A reading like this sits in "Greed" territory.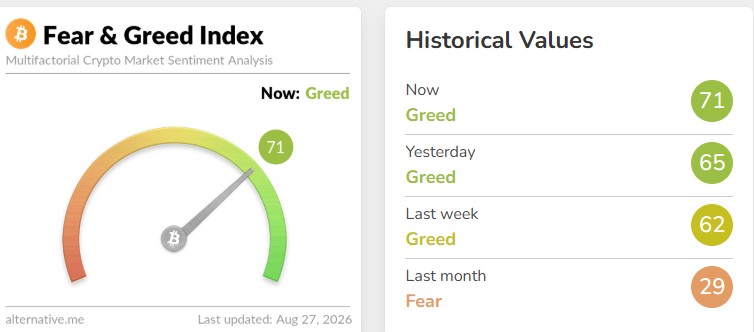
This shift lines up with steady money moving into spot ETFs. When big funds keep buying, it usually means confidence is building, at least for now.
Bitcoin spot ETFs pulled in an average of $232 million on Wednesday alone. Last week's total hit $1.92 billion, the strongest week since October.
This week's inflows already stand at $884 million through Wednesday. That's a lot of fresh money entering the market in a short window.
What is driving Bitcoin's price higher today?
Bitcoin is trading above $79,500, holding well above its key Exponential Moving Averages (EMAs). That keeps the near-term bias firmly bullish.
The move reinforces a structural floor built after Bitcoin broke through a downward resistance trendline near $68,020 earlier.
CryptoQuant's Bull Score, a 0-100 gauge built from 10 on-chain and market metrics, jumped from 30 to 80 in just one week. Readings above 60 have historically lined up with longer rallies.
But the Relative Strength Index (RSI) is sitting at 81, a sign of overstretched conditions. The MACD indicator is also retreating from recent highs, hinting that upside momentum is strong but starting to cool.
CryptoQuant flagged some warning signs too. Trader profit margins are stretched at 20.5%, whales have booked record profits, and exchange inflows are rising across BTC, ETH, and XRP.
A short pullback near the $83,000 moving average "would be unsurprising, and healthy" before any new trend continues, the firm noted.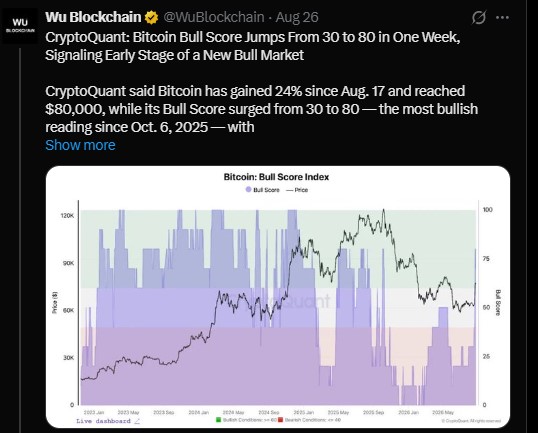
Bitcoin key levels to watch
Level Type
Price Zone
What It Means
Immediate Support
$79,500
Current price floor on the daily chart
200-day EMA Support
$72,064
Deeper support if price pulls back
EMA Cluster Support
$68,020 - $68,225
Broader demand zone near trendline break
Breakout Trigger
$80,000
Daily close needed to confirm next leg up
Upside Targets
$83,000, $88,000
Next levels if $80,000 holds
None of these levels guarantee a specific outcome. They're simply the zones traders are watching most closely right now.
Is Ethereum price ready to break $2,600?
Ethereum is trading at $2,530, extending a bullish near-term bias as price holds well above its key EMAs. That points to a solidly supported uptrend structure.
Momentum remains strong, with the MACD in positive territory. But the RSI near 78 keeps Ethereum in overbought territory, suggesting the rally could face consolidation or short corrective pullbacks.
Derivatives data backs up the recent strength. Ethereum futures volume jumped to $47.99 billion in 24 hours, up 18.57%. Open interest rose 6.11% to $34.35 billion.
Options volume climbed even more, up 34.10% to $1.41 billion. Short liquidations hit $78.32 million, well above the $24.87 million in long liquidations, a sign that short sellers got caught off guard by the recent rally.
US spot Ethereum ETFs added $192 million in fresh inflows, with BlackRock's ETHA fund alone bringing in about $116 million of that total.
Ethereum support and resistance levels
Level
Price
Notes
Initial Demand
$2,153
200-day EMA, first major support on a pullback
Broader Support Zone
$2,005 - $2,044
50-day and 100-day EMA cluster
Resistance
$2,550 - $2,600
Whale sell walls reported here
Upside Targets
$2,700, $2,800, $3,000
If resistance breaks and holds
As long as ETH holds above its EMA layers, the broader technical picture continues to favor buyers, even if overbought readings trigger short pauses along the way.
What is the XRP price prediction right now?
XRP is trading at $1.44, extending its bullish breakout above the main moving averages. The token now holds above its 50-day, 100-day, and 200-day EMAs.
This points to a firmly supported near-term structure, built after XRP reclaimed a falling trendline break area near $1.00.
The RSI at about 72 is pushing into overbought territory, while the MACD remains positive and above zero. That hints that upside momentum is strong but increasingly stretched.
Spot XRP ETFs just logged their seventh straight day of net inflows. On August 26, funds added $28.14 million, according to SoSoValue, pushing cumulative inflows to $1.62 billion.
Futures data shows $6.49 billion in 24-hour volume, up 6.51%, with open interest at $3.55 billion. Liquidations totaled $16.83 million, with $11.45 million coming from long positions, showing leveraged buyers got caught off guard by recent volatility.
XRP key support and resistance zones
Level Type
Price
What It Means
Immediate Support
$1.44
Day open pivot
200-day EMA Support
$1.35
Deeper floor if price pulls back
Lower EMA Support
$1.17 - $1.20
50-day and 100-day EMA cluster
Trendline Support
$1.00
Reclaimed breakout level
Resistance
$1.66
Downward-sloping trendline start point
Buyers could face profit-taking near $1.66 if the current overbought signals begin to unwind, though the broader structure still favors continued strength for now.
What's the bottom line for crypto prices today?
Bitcoin, Ethereum, and XRP are all showing signs of renewed strength, backed by steady ETF inflows and improving sentiment across the board.
At the same time, overbought RSI readings on all three, plus stretched trader profit margins, suggest the market isn't fully in the clear yet.
Traders seem to be watching the same theme across all three assets: will resistance break, or will profit-taking trigger a pullback first. The next few sessions near these key levels should offer some answers.
Disclaimer
This article is for informational purposes only and does not constitute financial, investment, or trading advice. Cryptocurrency prices are highly volatile and involve significant risk. Past performance does not guarantee future results. Always conduct your own research and consult a licensed financial advisor before making any investment decisions.