Why Are Bitcoin, ETH, XRP Prices Up Today? What's Driving the Rally? The crypto market is up today, and the numbers are hard to ignore. Bitcoin price broke above $80,000 on Tuesday, its highe
Why Are Bitcoin, ETH, XRP Prices Up Today? What's Driving the Rally?
The crypto market is up today, and the numbers are hard to ignore. Bitcoin price broke above $80,000 on Tuesday, its highest level in more than three months. Ethereum price and XRP price are climbing right alongside it, with XRP news showing the token up more than 50% in a week.
Traders are watching September's CLARITY Act vote closely. That, combined with a weaker U.S. dollar, is fueling fresh momentum across Bitcoin, Ethereum, and XRP.
Here is a full breakdown of why the crypto market is up today, plus where Bitcoin price prediction, Ethereum price prediction, and XRP price prediction models see things heading next.
Why Is Bitcoin Going Up Today?
Bitcoin price crossed $80,000 for the first time since May. That is a high psychological level for traders.
A soft U.S. dollar is doing a lot of the work here. Treasury Secretary Scott Bessent moved to calm the bond market, and that weakened the dollar. When the dollar weakens, investors often look for other places to park money. Bitcoin is one of them.
The U.S. Treasury also doubled long-dated bond buybacks. That pushed yields lower and pushed even more investors toward Bitcoin and gold, two assets that had lagged behind most of this year.
Bitcoin surged more than 25% in the past week. Part of that move came from a short squeeze, where traders betting against Bitcoin were forced to buy back in as the price rose, adding fuel to the rally.
Rising U.S.-Iran tensions and concerns about the national debt hitting $40 trillion added more pressure on the dollar, which again worked in Bitcoin's favor. The 30-year Treasury yield climbed to its highest level since 2007 during this stretch.
What Is Driving The CLARITY Act News?
President Trump called on Congress last week to pass the CLARITY Act. This bill would set clear legal rules for digital assets in the United States.
Trump hosted crypto executives at the White House and pushed hard for the bill. He said the legislation would "keep us ahead of China, keep us ahead of everyone else."
The crypto industry has wanted clear rules like this for years. A vote is expected in September, and traders are positioning ahead of it.
Hedge fund billionaire Ray Dalio added to the mood with a blog post last Friday. He warned of a looming debt crisis and said investors should lean away from bonds and toward gold and a bit of Bitcoin.
Bitcoin-Linked Stocks Rally Too
Strategy (MSTR) and Coinbase (COIN) shares were up 3% each in overnight trading ahead of Tuesday, building on sharp gains from the prior week.
Strategy announced Monday it created a new $1.59 billion "USD Cash" pool for investments. This fund sits separate from its existing $5 billion "USD Reserve" and gives the company more flexibility to respond to swings in Bitcoin or its own stock price.
Retail chatter around both stocks has turned notably bullish. One trader on Stocktwits pointed to the mid-$80,000s as the level that could send Bitcoin toward $100,000. Another flagged that Coinbase shares near $198 to $200 could be in play if Bitcoin holds above $80,000.
Why Is Ethereum Going Up Today?
Ethereum price is up 32% over the past week. ETH trades near $2,501.63, up 2.29% on the day.
Ether is pushing into a tough resistance zone between $2,550 and $2,600. This area lines up with the 100-week EMA, a level that has rejected price more than once this year.
Futures volume jumped 42.95% to $68.80 billion. Open interest is up 3.40% to $32.97 billion. Options volume rose 14.73% to $1.59 billion. Rising volume next to rising price is usually read as a healthy sign, not a warning sign.
Ethereum is trading above both its 50-week EMA ($2,375) and 200-week EMA ($2,456), which keeps the bigger trend leaning bullish.
Why Is XRP Going Up Today?
XRP price is outpacing both Bitcoin and Ethereum today. The token jumped more than 50% and is trading near $1.49.
XRP just broke through resistance that had held for seven months. That is a meaningful technical event for a token that had been stuck in a range since early this year.
XRP ETFs are also adding support. XRP ETFs pulled in $13.82 million in net inflows in a single session. Bitwise led with $8.25 million, followed by Franklin Templeton's XRPZ at $4.01 million and Canary Capital's XRPC at $1.57 million.
Total cumulative XRP ETF inflows have reached roughly $1.57 billion, with combined XRP ETF assets near $1.44 billion.
How Much Money Got Liquidated in the Crypto Market Today?
The crypto market saw heavy liquidations over the past 24 hours as short sellers got squeezed out. Total liquidations hit approximately $683.80 million across nearly 98,687 traders.
Timeframe
Total Liquidations
Long Positions
Short Positions
1 hour
$5.73M
$4.08M
$1.65M
4 hours
$63.15M
$51.83M
$11.32M
12 hours
$373.02M
$75.62M
$297.40M
24 hours
$683.80M
$224.56M
$459.24M
Bitcoin accounted for the largest share of liquidations at $354.59 million. Ethereum followed at $156.38 million. The data points to elevated volatility and the risk that comes with leveraged crypto trading.
How Much Money Is Flowing Into Crypto ETFs?
Institutional demand stayed strong on August 24.
Asset
Net Inflows
Top Issuer
Bitcoin ETFs
$338 million
BlackRock IBIT ($209M)
Ethereum ETFs
$116 million
BlackRock ETHA ($90.92M)
XRP ETFs
$13.82 million
Bitwise ($8.25M)
BlackRock, which manages roughly $15.3 trillion in assets, remained the top issuer across both Bitcoin and Ethereum ETF flows.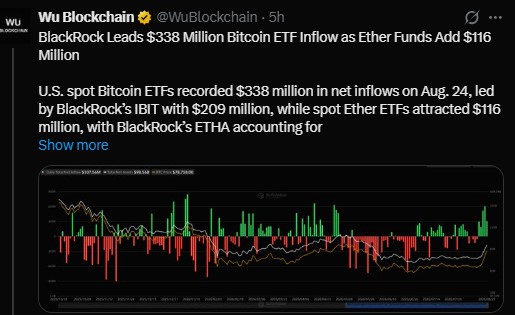
Bitcoin Price Prediction: What's Next For BTC?
Market odds of Bitcoin trading above $100,000 before year-end have climbed to 29% following last week's rally, according to prediction market data.
Not every trader is convinced this breakout is confirmed. Some using Smart Money Concepts point to a bearish order block between $80,000 and $83,000. This zone lines up with the most recent lower high on the daily chart.
Under that view, Bitcoin needs a strong daily close and acceptance above $83,000 to invalidate the bearish structure. A quick wick above the zone would not be enough on its own.
If that rejection happens, price could fall back toward $70,000, $60,000, or even $50,000 in a deeper pullback.
If Bitcoin does close and hold above $83,000, traders following this method would watch for a retest of that same order block. A higher low forming after the retest would count as a bullish change of character, often called a CHoCH in trading shorthand.
Until that sequence plays out, some traders see this bounce as a move into a premium price zone within a larger downtrend, not a confirmed reversal.
Scenario
Bitcoin Price Target
Holds above $80,000
$85,000, then $90,000
Confirms close above $83,000
Retest of order block, path toward $100,000
Loses $80,000
$72,000 to $75,000 range
Deeper rejection
$70,000, $60,000, or $50,000
Ethereum Price Prediction: Can ETH Break Above $2,600?
Ethereum sits just under the $2,550 to $2,600 resistance zone after a strong run from the $1,900 to $2,000 support base. That reclaim gave bulls the momentum to push through $2,100 resistance and straight into this liquidity pocket.
Level
Price Zone
Type
Immediate resistance
$2,550 - $2,600
100-week EMA
Support 1
$2,456
200-week EMA
Support 2
$2,375
50-week EMA
Support 3
$2,085
20-week EMA
Major support
$1,500 - $1,700
Long-term trendline
A weekly close above $2,600 would be the strongest signal yet that Ethereum has flipped this old ceiling into fresh support.
If Ethereum breaks above $2,600, the next stop is $2,800 to $3,000, followed by $3,250 to $3,500. A sustained move past that could open a run toward $4,000, with the long-term trendline near $4,750 to $5,000 as the bigger target further out. None of this is guaranteed, since Ethereum has failed at this exact zone before and could fail again.
If Ethereum gets rejected here, the price could fall back toward $2,456, then $2,375. Losing the 20-week EMA near $2,085 would weaken the bullish case and open the door to a deeper pullback toward $1,500 to $1,700. For now, the structure still favors buyers, but the resistance zone has not been cleared yet.
XRP Price Prediction: How High Could XRP Prices Go?
Chart watchers are mapping out a multi-wave structure for XRP, meaning the token could move in stages rather than a straight line up.
The first resistance zone to watch sits between $1.53 and $1.64. XRP has pushed right into this area after its sharp recovery.
If buyers turn that zone into support, some analysts see a path toward $1.79 next. After that, a pullback toward $1.27 to $1.30 is possible before another leg higher.
Further out, chart-based targets point to $2.58, then $2.86 to $2.89. These are projections based on wave patterns, not guarantees, and price can just as easily fail at resistance and drop instead.
Scenario
XRP Price Target
Holds $1.55 support
Bullish structure stays intact
Clears $1.53-$1.64 resistance
$1.79 next stop
Pullback before next leg up
$1.27 to $1.30
Longer-range wave targets
$2.58, then $2.86-$2.89
Loses $1.55
Slip back toward $1.30 or lower
The $1.55 zone that capped XRP for seven months is now the line in the sand. Since XRP tends to follow the broader market mood, weakness in Bitcoin or Ethereum could cap its upside even if its own chart looks strong.
Bitcoin holding $80,000 could open a path toward $85,000 and $90,000, while a failure there could send it back to $72,000-$75,000, and XRP would likely feel that move either way.
Disclaimer
This article is for informational purposes only and does not constitute financial, investment, or trading advice. Past performance and technical projections do not guarantee future results. Always do your own research and consult a licensed financial advisor before making investment decisions.