The crypto market is green on Tuesday. Bitcoin, Ethereum, XRP, and Solana prices are all moving higher, though the gains are small and steady. The total crypto market is up 1.14% and sits nea
The crypto market is green on Tuesday. Bitcoin, Ethereum, XRP, and Solana prices are all moving higher, though the gains are small and steady.
The total crypto market is up 1.14% and sits near $2.88 trillion. Traders seem cautious but a bit hopeful.
What Are the Bitcoin, Ethereum, XRP and Solana Prices Today?
Here is where the four coins stand right now.
Coin
24H Change
Current Level
Bitcoin (BTC)
+1.40%
Above $84,000
Ethereum (ETH)
+2.2%
Above $2,700
XRP
+1.33%
Above $1.50
Solana (SOL)
+1%
Near $120
Ethereum is the strongest of the group today. Solana is the slowest, but it is still in the green.
Why Is Crypto Going Up Today?
There is no single big trigger. Instead, a few smaller things are helping at once.
ETF money is still coming in. Chart patterns look decent for Bitcoin and Ethereum. And market mood remains positive, even if it cooled a little from last week.
That said, some of the ETF numbers have dropped. More on that below.
Are Crypto ETFs Still Seeing Inflows?
Yes, but the pace has slowed. Bitcoin spot ETFs took in $31 million on Monday. Last Friday, the number was $134 million.
Last week alone, US-listed Bitcoin ETFs pulled in $2.4 billion. That shows strong interest from big investors.
Ethereum spot ETFs also cooled. They saw $17 million in inflows on Monday, down from $87 million on Friday. Total inflows are near $14 billion, and assets under management are close to $18 billion.
Two other US-listed spot ETFs also posted smaller numbers:
ETF Product
Monday Inflow
Last Friday
Streak
Cumulative Inflows
Net Assets
Spot ETF A
$4 million
About $23 million
5 days
Near $1.8 billion
About $1.7 billion
Spot ETF B
$12.70 million
About $86.67 million
10 days
Near $1.62 billion
About $1.93 billion
Data source: As per SoSoValue. The report does not clearly name which coins these two ETFs track.
Slower inflows can mean prices pause and move sideways for a while. Not a crash signal, just less push.
What Is the Crypto Fear and Greed Index Right Now?
The index reads 73 today, which means "Greed." It was 74 yesterday and 78 last week. That earlier reading was "Extreme Greed." A month ago it stood at 69.
So mood is still positive, but a little less heated than seven days ago.
Is Bitcoin About to Break Out Above $84,000?
Bitcoin is close. It is trading just above $84,000 and pushing toward a breakout.
Some traders see a double bottom pattern on the chart. BTC tested that pattern, found support, and is now moving back up.
If $84,000 holds as support, the retest could give buyers an entry before the next move. The pattern's target is $100,000. That is a chart target, not a promise.
What Is the Ethereum Price Outlook?
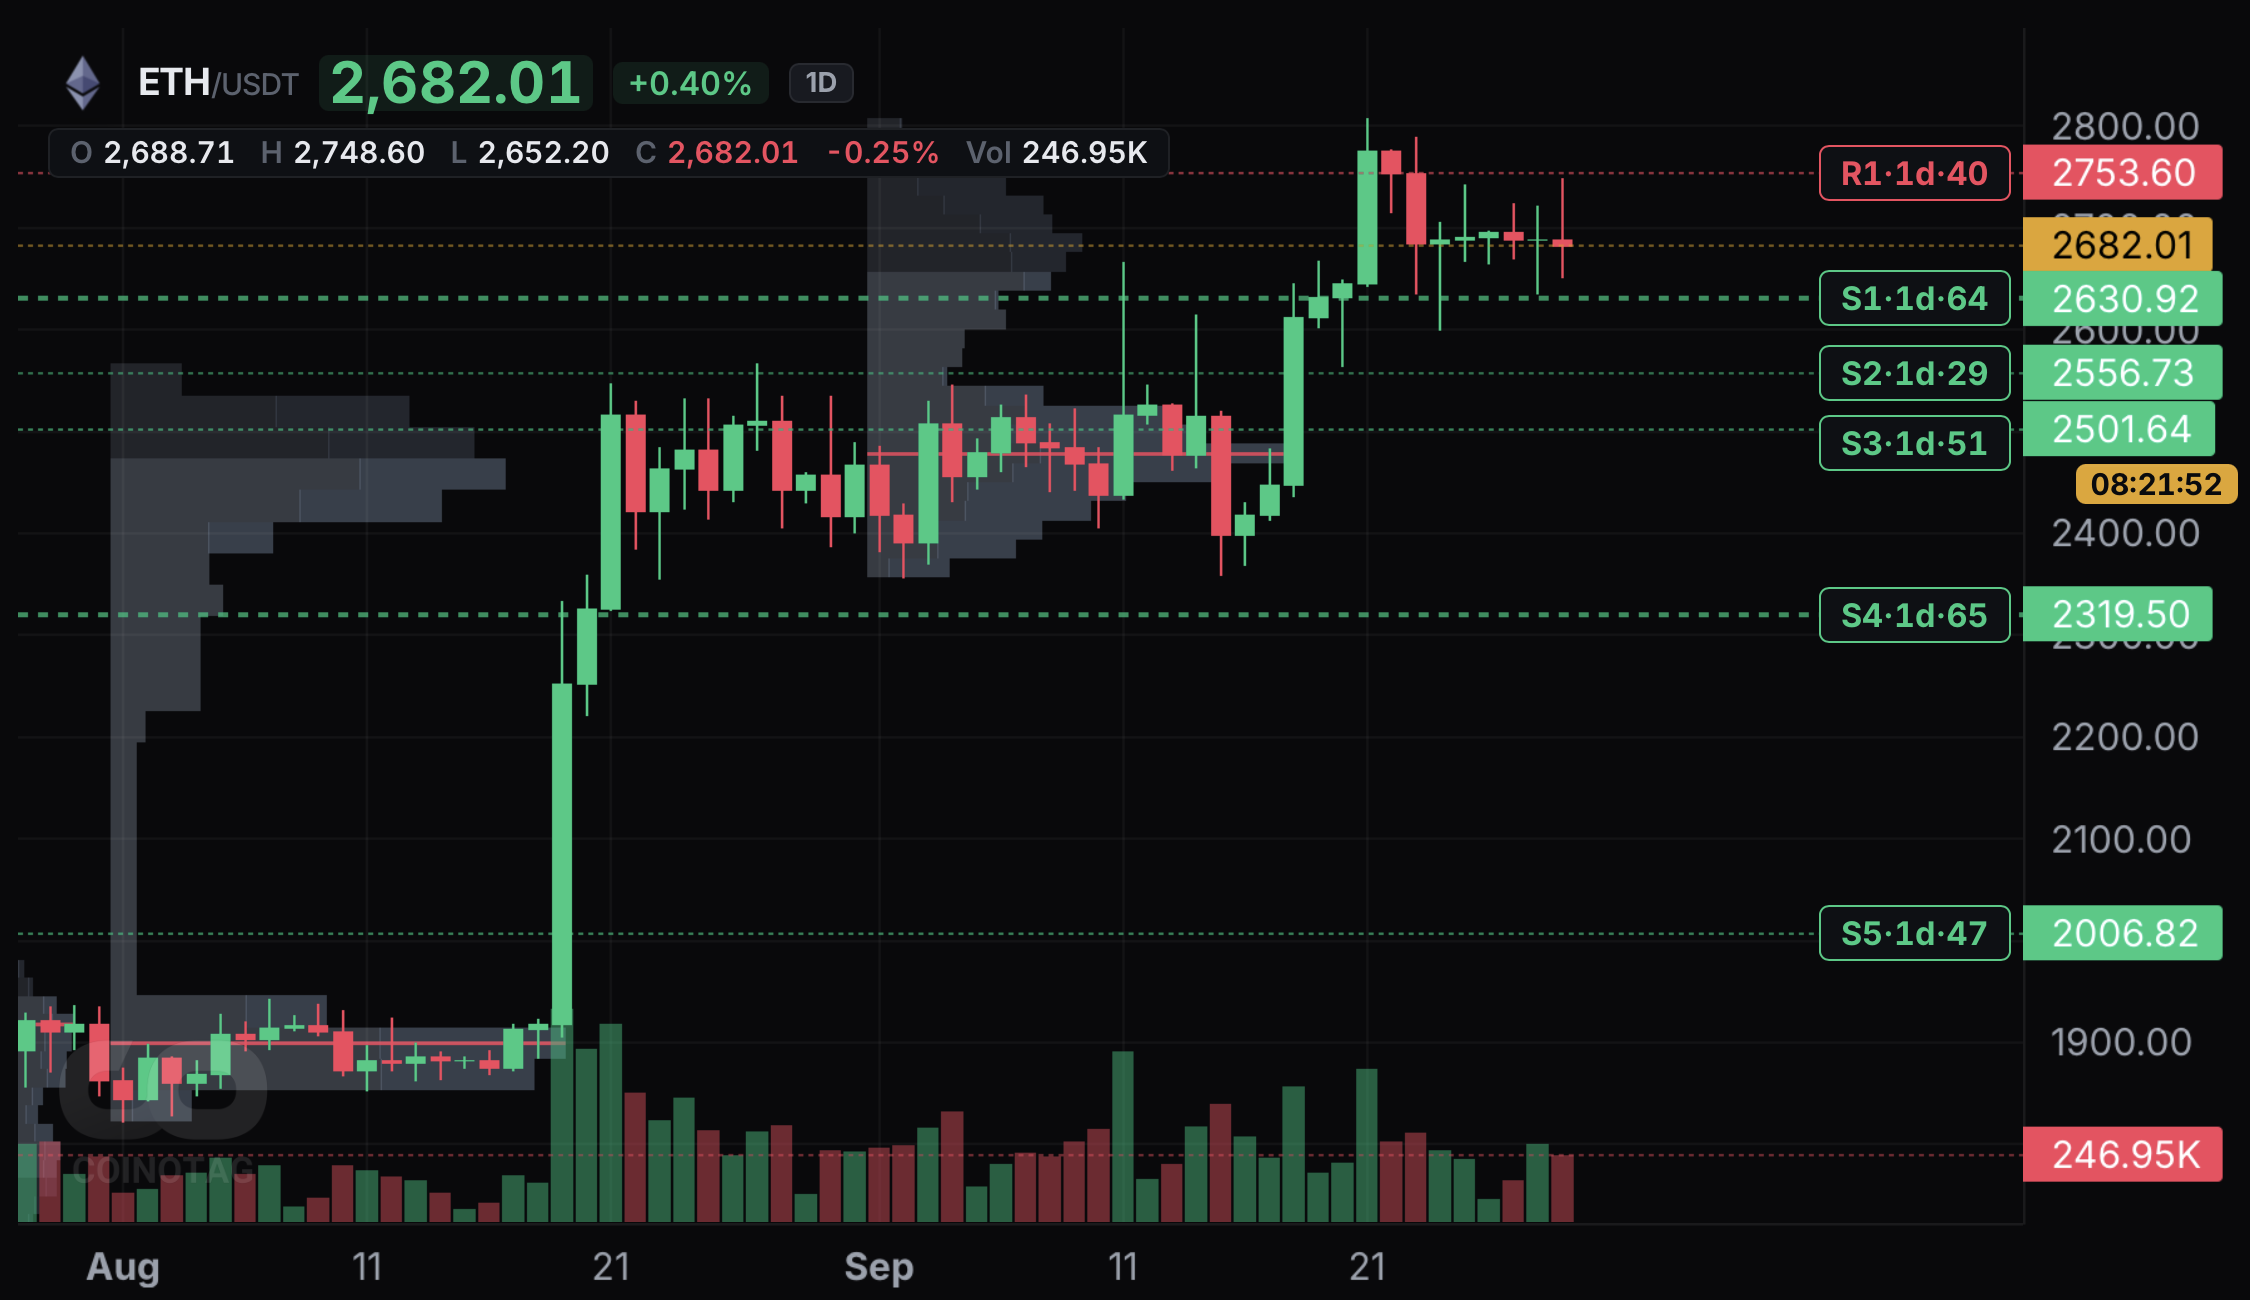
Ethereum may be forming a bull flag on the lower timeframes. That is a pause pattern that sometimes comes before another leg up.
The level to watch on the downside is $2,640. As long as it holds, the setup favors bulls.
On the upside, $2,700 matters. An hourly close above it could confirm a breakout and open the way toward $3,000. If $2,640 breaks, the idea weakens.
Why Is Solana Price Moving Up?
Solana has ETF support behind it. US spot Solana ETFs have collected about 4.37 million SOL since July 13. That is worth roughly $450 million.
It also marks 11 straight weeks of net inflows. Some traders are eyeing $150 as the next area to watch.
Solana is still hovering near $120, so it has some distance to cover.
What Is the XRP Price Prediction Based on Support and Resistance?
On the daily chart, XRP sits above all four major moving averages. It also trades inside a widening, megaphone-style pattern. That pattern stays valid while price holds above $1.45 to $1.46.
The RSI reads 57.73, and its signal line is at 58.08. That is mildly bullish and not overheated.
Indicator
Level
20 EMA
$1.4589
50 EMA
$1.3674
100 EMA
$1.3081
200 EMA
$1.3705
Zone
Type
What It Means
$1.45 to $1.46
Support
Key zone, near the 20 EMA
$1.37 to $1.40
Support
Retest area if $1.46 breaks
$1.55 to $1.60
Resistance
First hurdle for buyers
$1.65 to $1.70
Resistance
Next target on a breakout
$1.80
Resistance
Higher target area
The September high is near $1.66. The late August spike touched about $1.70. Sellers showed up at both spots before.
Is the XRP Price Forecast Bullish or Bearish?
It depends on which level breaks first.
Bullish case: A move above $1.55 to $1.60 could open the path to $1.65 to $1.70. After that, traders may look at $1.80.
Bearish case: A firm break below the 20 EMA near $1.46 would weaken the setup. A retest of $1.37 to $1.40 could follow, where the 50 EMA and 200 EMA sit close together.
Sideways case: Price could also just chop between $1.46 and $1.60 for a while.
Nobody knows which one plays out. Watching the levels is more useful than guessing.
How Many Traders Were Liquidated in the Last 24 Hours?
According to CoinGlass data, 95,170 traders were liquidated in the past 24 hours. Total liquidations came in at $392.37 million.
Long traders lost more over the full day. But the picture flips in the shorter windows.
Time Frame
Total Liquidations
Longs
Shorts
1 hour
$18.39M
$1.57M
$16.82M
4 hours
$43.87M
$6.80M
$37.06M
12 hours
$147.69M
$84.28M
$63.41M
24 hours
$392.37M
$253.32M
$139.05M
In the last hour and the last four hours, short sellers took the bigger hit. That fits with prices ticking up today, since rising prices force bearish bets to close.
Ethereum saw the most liquidations at $86.89 million. Bitcoin followed with $70.57 million. Other big names included ZEC at $40.20 million, NEAR at $14.33 million, and SOL at $12.23 million.
The largest single liquidation happened on Binance in the ETHUSDT pair. It was worth $11.82 million.
What Should Traders Watch Next?
A few simple things stand out.
Whether ETF inflows pick up again or keep fading
Bitcoin holding $84,000 as support
Ethereum closing an hour above $2,700
XRP staying above $1.45 to $1.46
The Fear and Greed Index, in case it slides further from 73
Liquidation numbers, since sharp swings can trigger more forced closes
Crypto moves fast. A calm day can flip quickly, so plan for both sides.
Disclaimer
This article is for information only. It is not financial, investment, or trading advice. Cryptocurrency prices are highly volatile, and you can lose some or all of your money. Price targets and chart patterns mentioned here are not guarantees. Always do your own research and speak to a licensed financial advisor before you invest.