Ethereum Has Spent a Month Around the Same Pivot As the daily chart shows, Ethereum was trading near $1,870 on August 15. The 0.382 Fibonacci retracement runs through the same area, while the
Ethereum Has Spent a Month Around the Same Pivot
As the daily chart shows, Ethereum was trading near $1,870 on August 15. The 0.382 Fibonacci retracement runs through the same area, while the 100-day simple moving average sits at $1,875, leaving less than $5 between the two indicators.
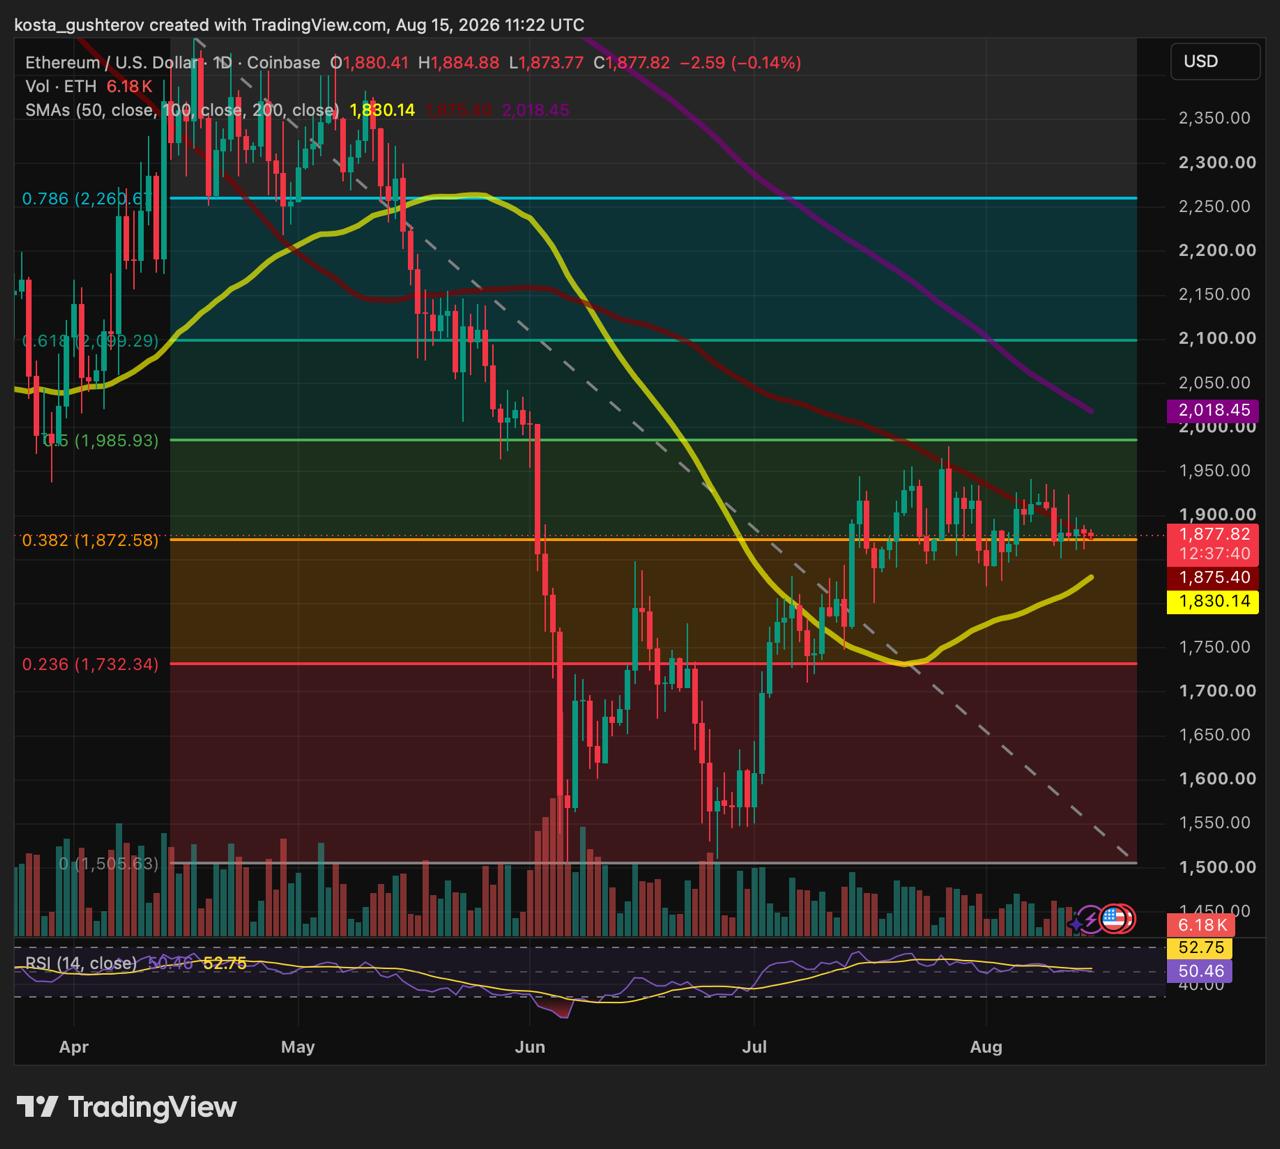
Ethereum daily price chart hovering near the 0.382 Fibonacci retracement level.
This is the area ETH reclaimed in mid-July. At the time, our previous Ethereum price analysis identified $1,870 as the level that could confirm the breakout or send price back toward the former range. One month later, ETH has crossed it repeatedly without establishing a trend.
Most daily closes have remained between roughly $1,830 and $1,950. That makes the Fibonacci level the center of the consolidation rather than clean support. The next useful signal is more likely to come from the edges of the range than from another move through its midpoint.
Glassnode Shows Exhaustion, Not a Confirmed Bottom
The Glassnode Seller Exhaustion Constant has dropped to about 0.0055, near the floor of the range visible since 2022.
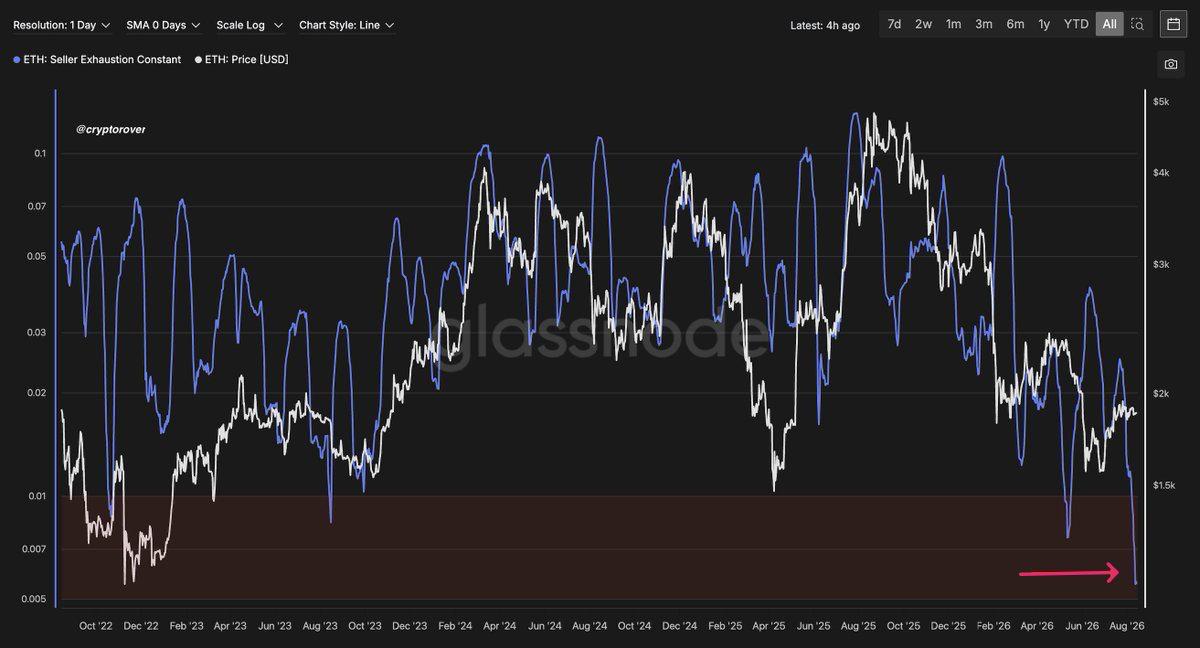
Glassnode chart tracking Ethereum’s price and Seller Exhaustion Constant.
Glassnode calculates the indicator by multiplying the percentage of ETH supply in profit by 30-day price volatility. A reading this low reflects both compressed volatility and a smaller profitable supply, conditions that can reduce the willingness or ability of marginal holders to keep selling.
The metric does not count active sellers, however, and it cannot confirm a bottom. ETH has stopped extending June’s decline, but recovery attempts have continued to stall between $1,900 and $1,950. The reading helps explain why the market has stabilized; it does not show that buyers are strong enough to end the consolidation.
A Five-Week ETF Inflow Streak Has Ended
Fund flows add the missing demand side of the picture. According to SoSoValue data, U.S. spot Ethereum ETFs recorded a $2.26 million net outflow in the week ending August 14. That ended five consecutive positive weeks in which the funds had attracted about $566 million combined.
The latest outflow was equal to only about 0.4% of the inflows accumulated during that run, so one red week is not enough to establish an institutional exit. It does show that the steady ETF bid present through much of the July recovery did not strengthen as ETH approached the upper end of its range.
Taken together, the Glassnode and ETF data partly explain why ETH keeps returning to $1,870. Selling pressure has eased, but fund demand has not accelerated enough to push price out of the range. Renewed ETF inflows could support another test of $1,950, while continued outflows would leave that breakout dependent on buyers elsewhere in the spot market.
READ MORE:
 World Liberty Gets Preliminary OCC Nod for Bank Charter
The Breakout Has Two Clear Boundaries
A daily close above $1,950 would clear the recent recovery highs and show that demand has finally displaced the month-long balance. The next tests would sit at the 0.5 Fibonacci retracement near $1,990 and the 200-day SMA around $2,020. Together, they form a stronger resistance band than the local highs alone.
On the downside, the rising 50-day SMA near $1,830 marks the lower edge of the current structure. Losing that average without a quick recovery would carry more information than another brief move below the midpoint. It would expose the 0.236 Fibonacci retracement near $1,730 and weaken the recovery built from the late-June low.
The two possible breaks would carry different messages. A move above the range would require buyers to overcome the remaining supply, while a drop below it could occur even without aggressive selling if bids around support weaken.
Technical indicators, on-chain metrics and ETF flow data describe current market conditions; they do not guarantee future price movements. This article is for informational purposes only and is not investment advice.
The post Why Ethereum Can’t Escape $1,870 Even as Sellers Retreat appeared first on Coindoo.