Key Highlights ETH trades at $2,324.49 (-1.76%) after rejection at $2,400 on October 28 — breakdown confirmed below $2,385.23 Whales sold ~160,000 ETH ($348M) in days as $100B volume spike co
Key Highlights
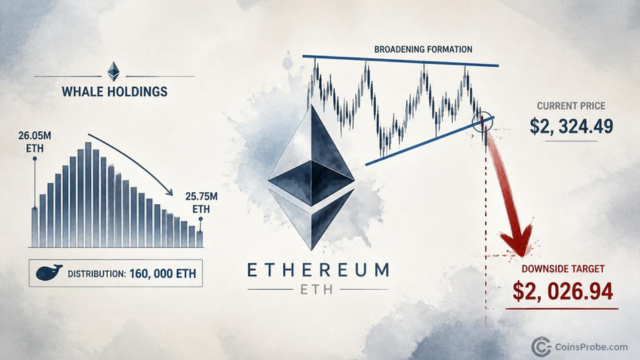
ETH trades at $2,324.49 (-1.76%) after rejection at $2,400 on October 28 — breakdown confirmed below $2,385.23
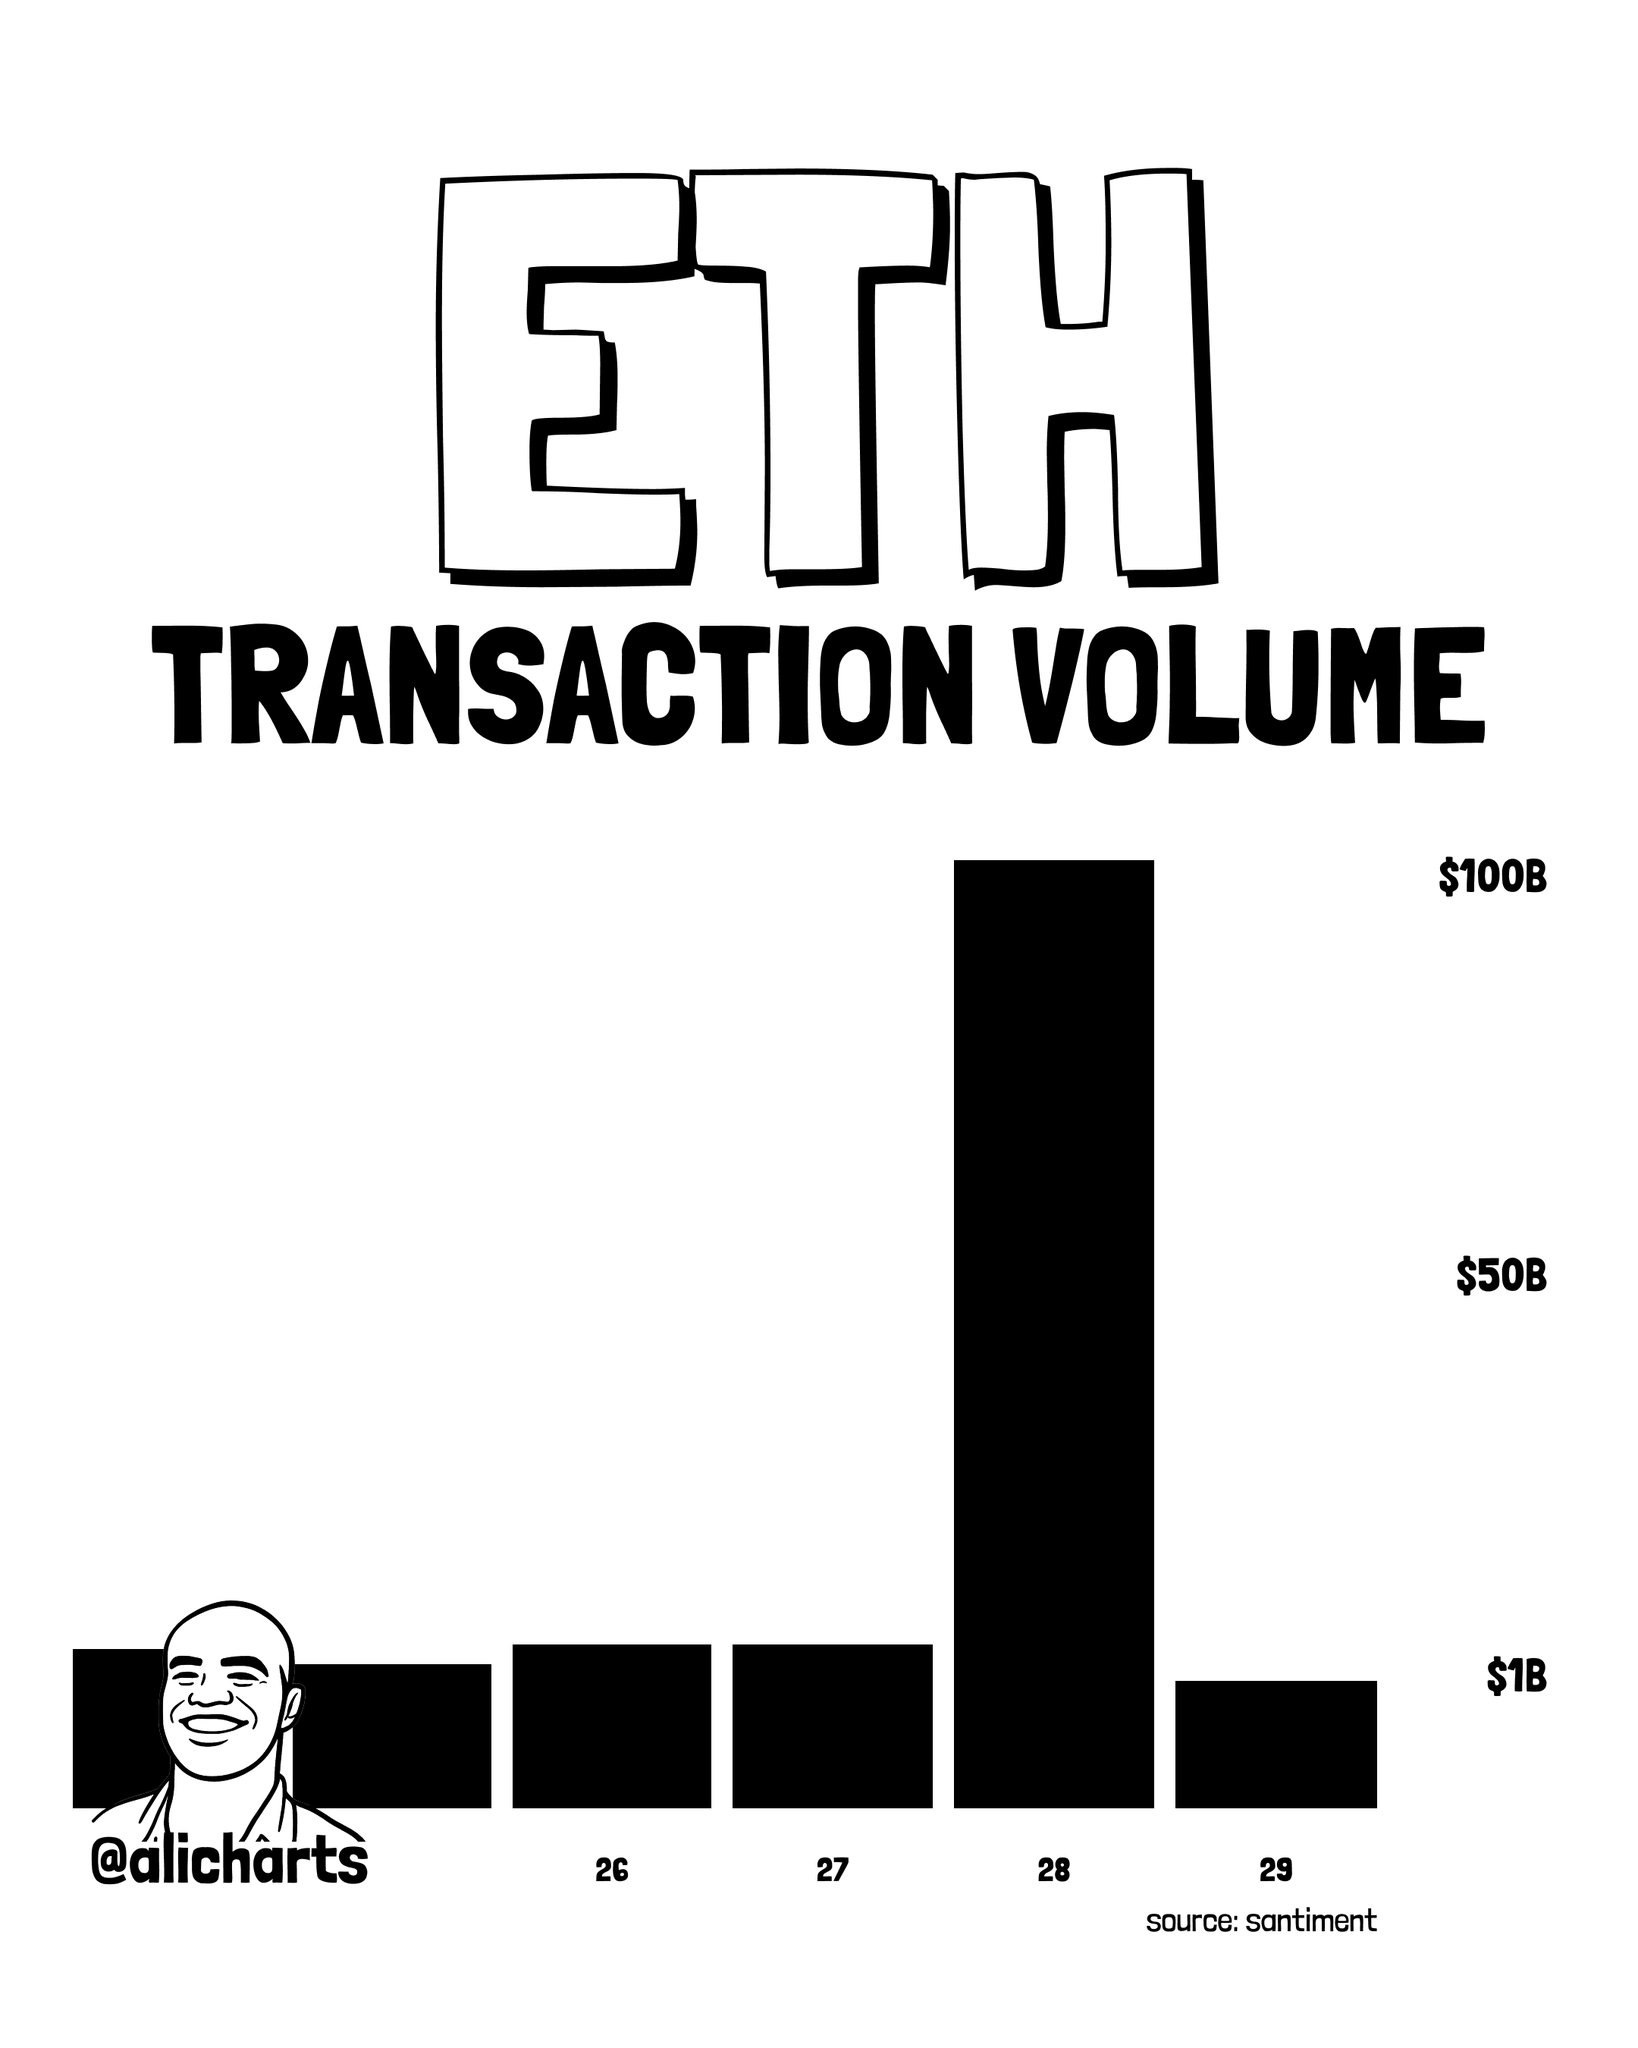
Whales sold ~160,000 ETH ($348M) in days as $100B volume spike collapsed immediately — classic distribution fakeout per @alicharts
Exchange balances rose 100,000 ETH ($240M) to 6.03M ETH while ETF outflows hit $276.4M over 5 days
Daily chart broadening formation breakdown targets $2,026.94 — next key level per Martinez's analysis
Ethereum is trading at $2,324.49 — down 1.76% in the last 24 hours — with a market cap of $284.3 billion. The weakness is not random. Three simultaneous on-chain signals are pointing in the same direction: a volume fakeout at $2,400, active whale distribution, and a confirmed chart pattern breakdown — all converging on a downside target of $2,000.
Crypto analyst Ali Martinez (@alicharts) published a six-part thread on October 29, 2026, documenting each signal with precision. His conclusion: the rejection at $2,400 was not a consolidation — it was a distribution event. “Whale holdings may help explain the weakness,” Martinez notes in the thread, pointing to coordinated selling that preceded the price slide.
As Ethereum approached $2,400 on October 28, on-chain transaction volume surged past $100 billion in a single day — a reading that appeared, on its surface, to signal explosive demand. It did not. Price was rejected at $2,400 and slid back below $2,300 within the same session. By October 29, volume had collapsed back toward baseline levels near the $1 billion range.
This is the textbook structure of a volume fakeout: a spike that attracts buyers, followed by immediate distribution into that liquidity. The surge past $100B did not reflect sustained buyer conviction — it reflected the moment large holders needed to offload size. The volume appeared; the price did not hold. That divergence is the signal.
ETH Transaction Volume Analysis | Source: @alicharts (X)
Santiment data flagged by Martinez shows that large ETH holders reduced their positions by approximately 160,000 ETH — worth more than $348 million — over the days surrounding the $2,400 rejection. The chart shows a clear inverted-V pattern in whale holdings: a peak around October 26, followed by a sustained decline through October 28–29, with the most recent readings approaching the 25.75 million ETH level on the y-axis.
This is not passive selling. The timing — concentrated around the exact price level where volume spiked — suggests coordinated distribution into retail buying pressure. When whales reduce positions at resistance, they are not exiting because they are wrong. They are exiting because they believe the level will not hold. It did not.

ETH Held by Whales | Source: @alicharts (X)
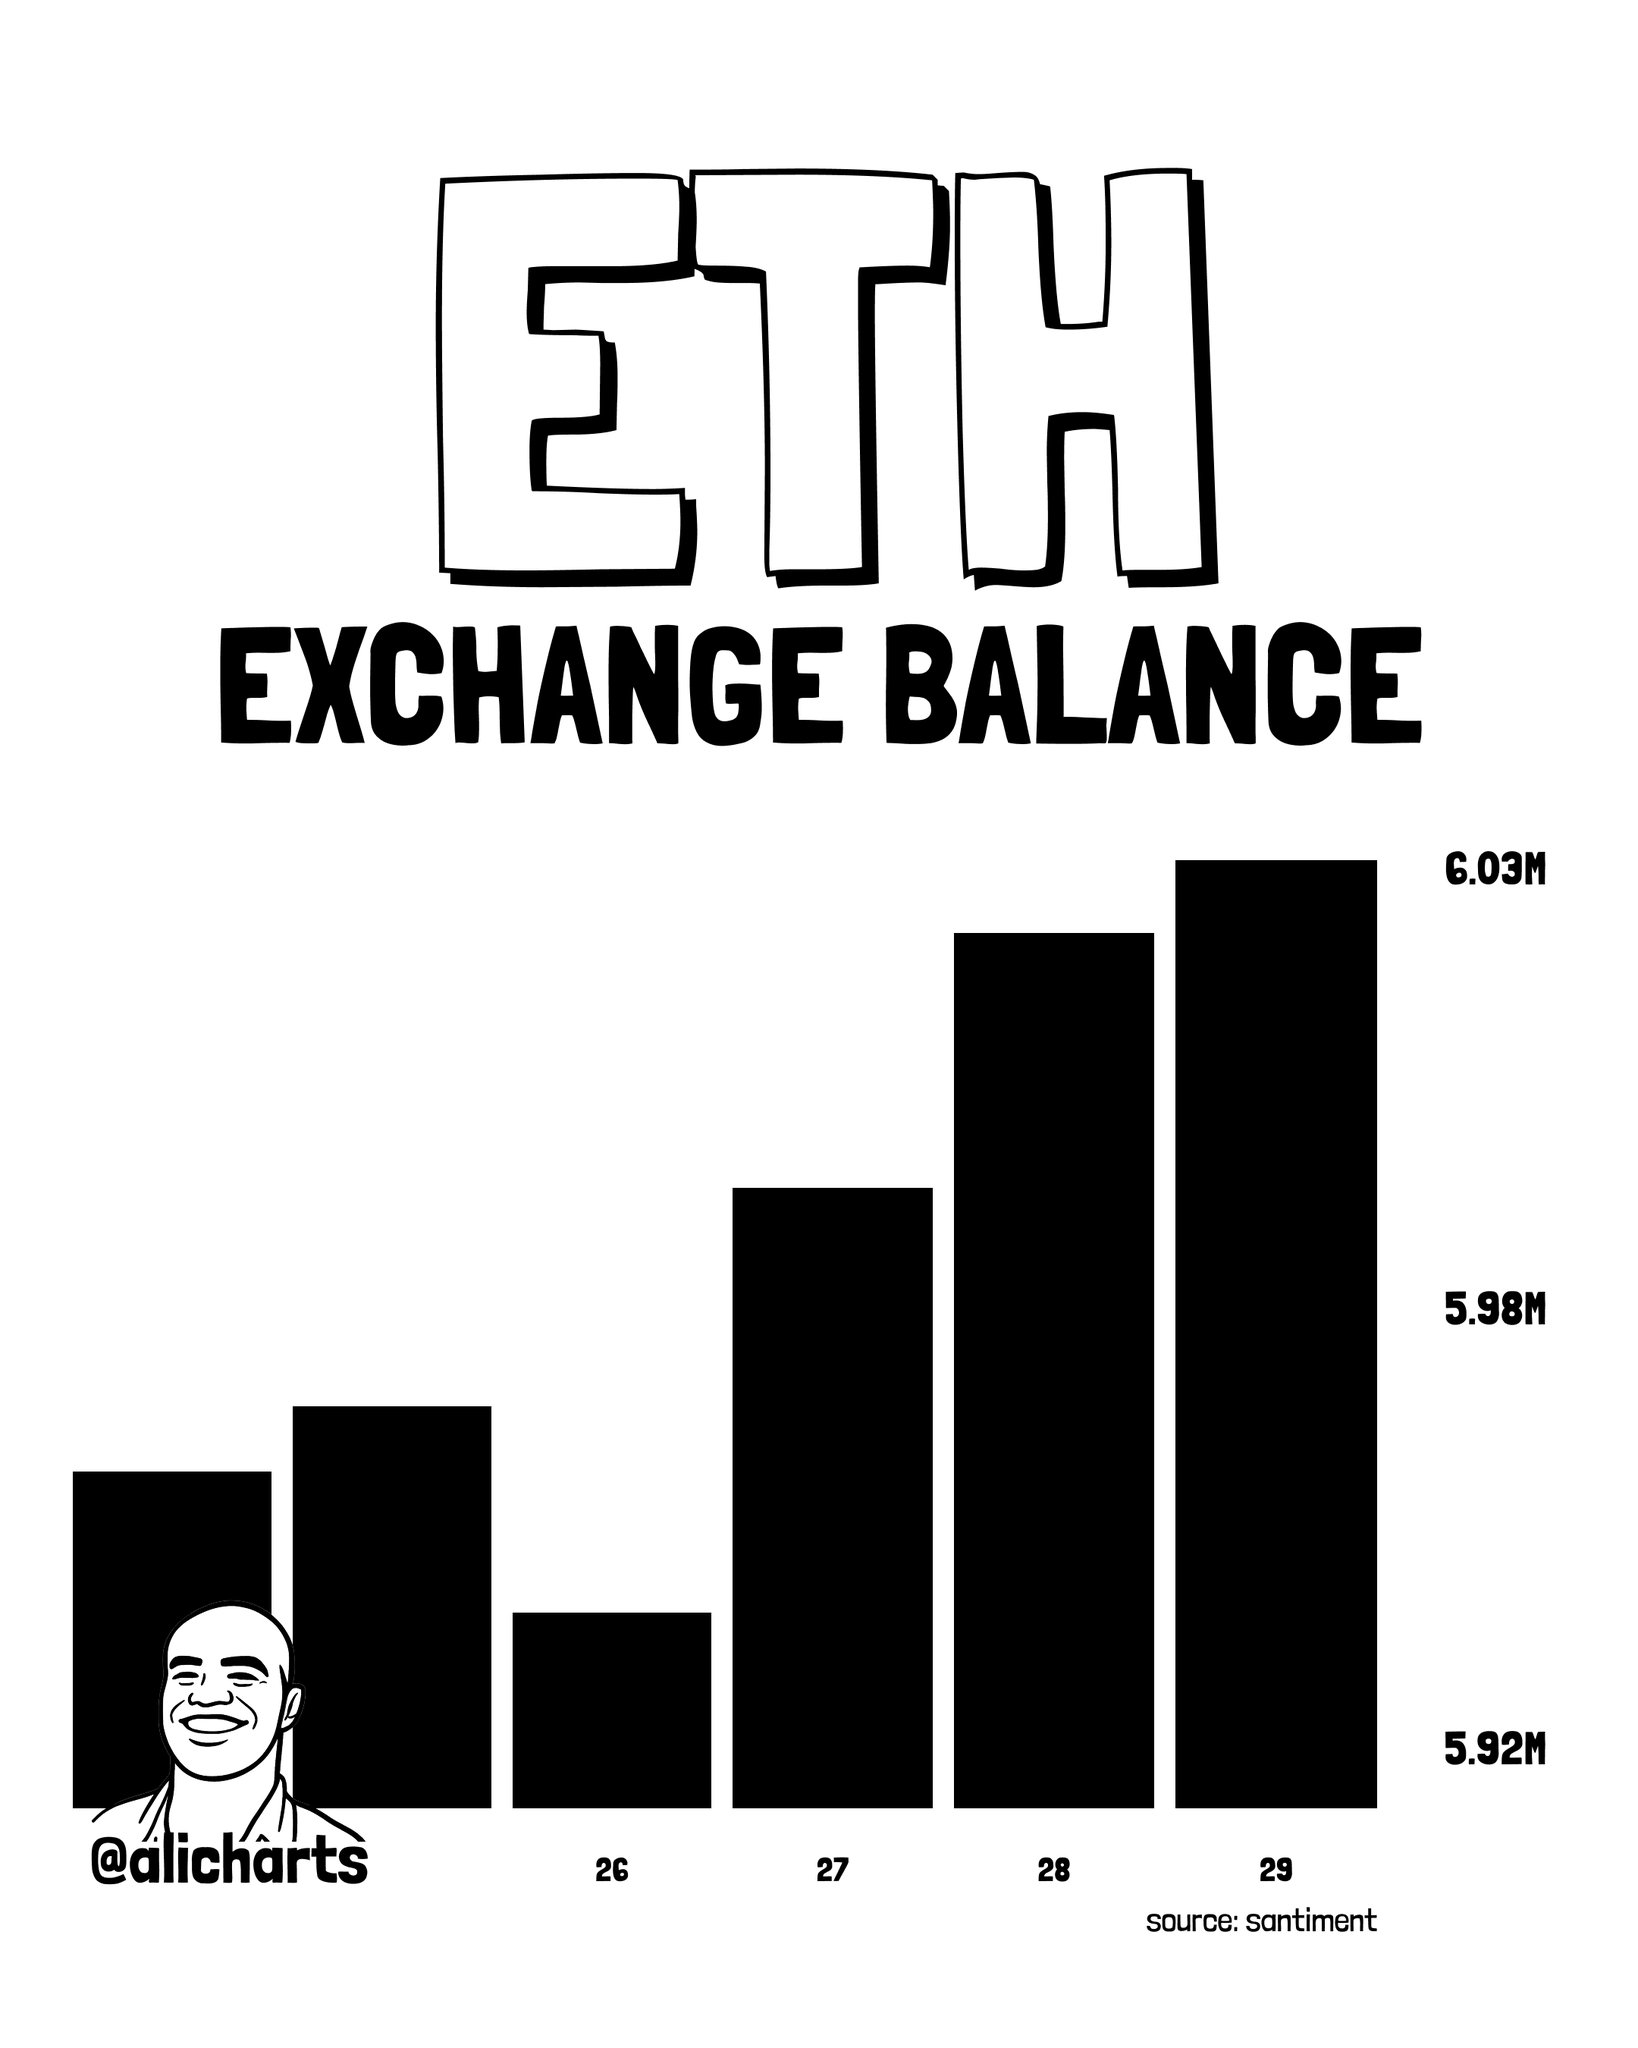
Simultaneously, Ethereum held on exchanges increased by approximately 100,000 ETH — worth roughly $240 million — over the same five-day window (April 25–29). Exchange balance moved from approximately 5.92 million ETH to 6.03 million ETH, with the highest reading recorded on October 29. The trend is still forming, with no reversal confirmed at the latest data point.
Rising exchange balances are a direct supply-side signal. ETH transferred to exchanges is ETH positioned to be sold. Combined with the 160,000 ETH in active whale distribution, the market is currently absorbing more than $588 million in combined selling pressure — whale offloading plus exchange-ready supply — concentrated in a matter of days.
ETH Exchange Balance | Source: @alicharts (X)
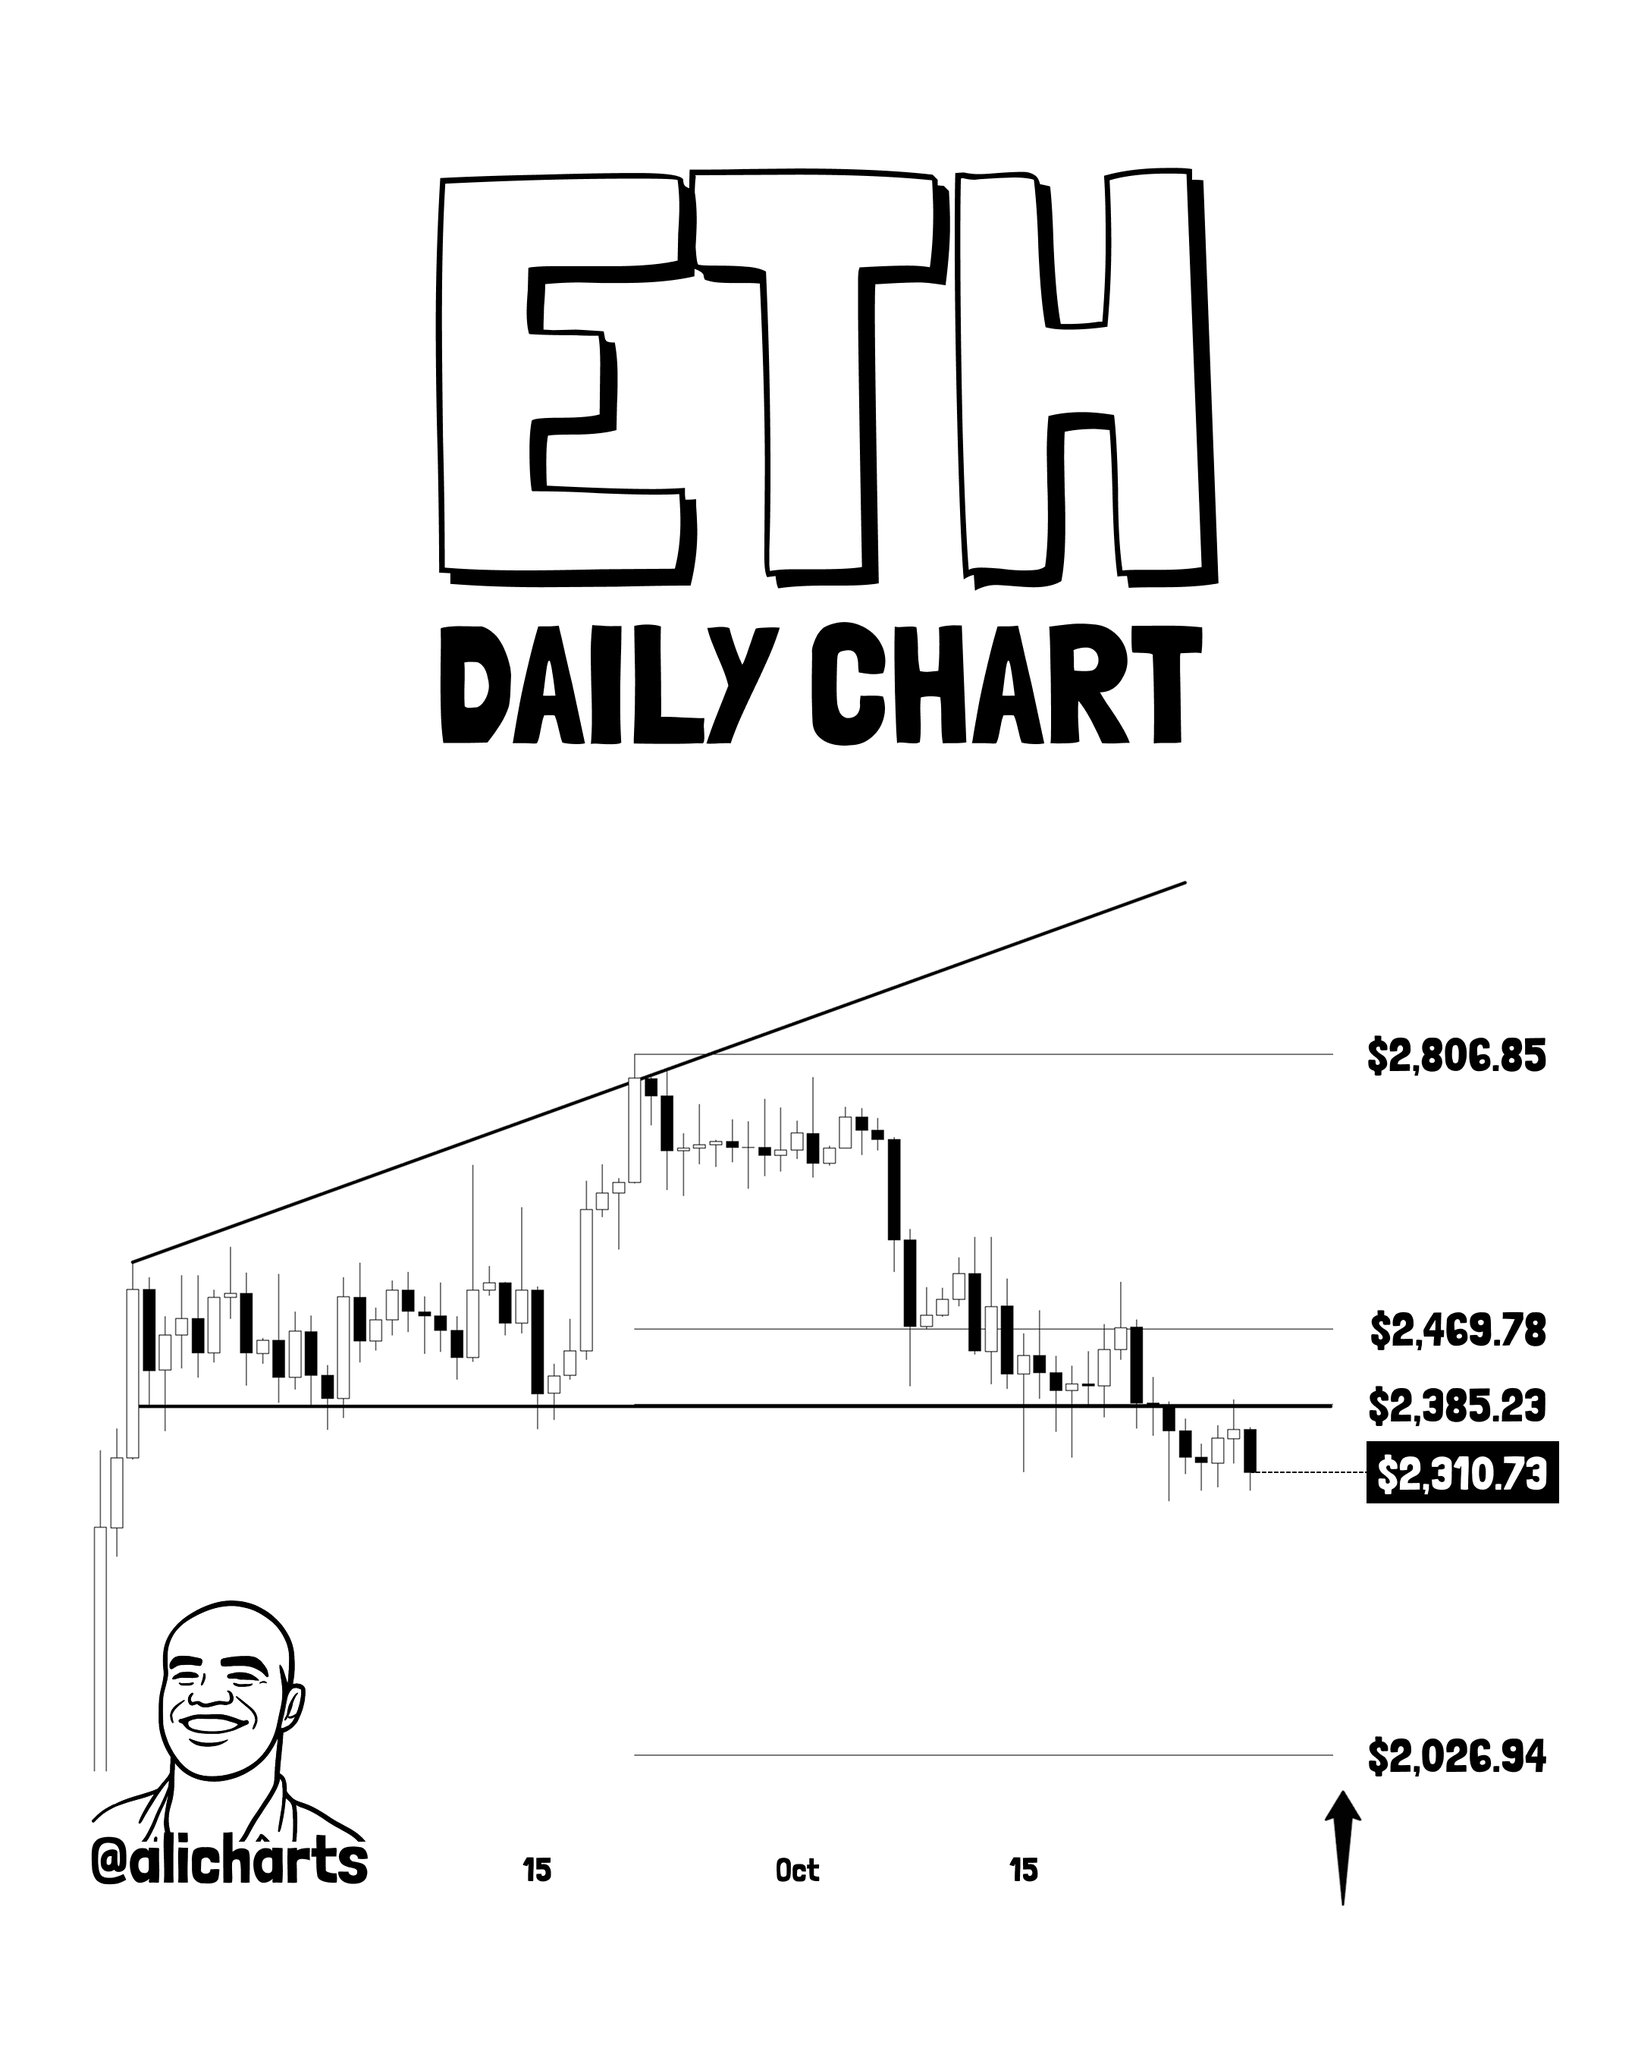
The daily chart shared by Martinez reveals a right-angled ascending broadening formation — a pattern defined by a flat upper horizontal resistance and a rising lower trendline. Price broke downward through the rising base trendline, then continued declining through multiple horizontal support levels. The $2,385.23 support has been lost. The current price, marked at $2,310.73 on the chart, sits below both $2,385.23 and $2,469.78. The breakdown is confirmed.
Martinez identifies $2,026.94 as the next significant level, represented on the chart with a directional marker below current price. This level aligns with the pattern’s measured projection and the $2,000 downside target that emerges from the combination of broken structure, rising exchange supply, and whale distribution. Ethereum has crossed 3.8 billion total transactions on-chain per Chainspect data — the network is active, but activity has not translated into price support.
ETH Daily Chart | Source: @alicharts (X)
Spot Ethereum ETF data from SoSoValue reinforces the on-chain picture. As of October 28, 2026, ETH spot ETFs recorded a daily net outflow of $21.4 million, extending a streak of three consecutive outflow days. Over the past five trading sessions, net outflows total $276.4 million across four of five days. ETHA, the largest fund with $7.45 billion in AUM, posted the heaviest single-day outflow at $44.8 million. Only FETH recorded an inflow — $18.8 million — insufficient to offset the broader trend.
Total ETF net assets stand at $14.27 billion against $12.55 billion in cumulative net inflows since launch, a spread that has compressed as redemptions accelerate. Institutional participants are not buying the $2,400 rejection — they are reducing exposure into it. For context on smart money positioning, one notable exception: a ETH smart trader opened a $45.34M 25x long position prior to this move — that trade now faces significant pressure.
Ethereum’s on-chain fundamentals, per DeFiLlama, remain intact: TVL at $45.88 billion, 24-hour DEX volume at $1.65 billion, and 24-hour fees at $9.97 million. These numbers reflect a functioning, heavily-used network. They do not, however, constitute a price catalyst in the current environment. Strong TVL did not prevent the $2,400 rejection. Strong fee generation did not stop the broadening formation from breaking down. Fundamentals set a floor for long-term value; they do not resolve near-term supply imbalances of the kind currently in motion.
The macro calendar adds further uncertainty. Markets currently price an 85.6% probability of the Federal Reserve holding rates at 4.00%–4.25% at the December 9, 2026 FOMC meeting, per SoSoValue. A hold is not inherently negative for risk assets, but it removes the catalyst of a rate cut from the near-term playbook. Key data releases in the coming days — ISM Manufacturing PMI on November 1, Services PMI on November 3, and CPI on November 9 — could shift that calculus. Any upside surprise in inflation data would weaken the case for policy easing and apply additional pressure on ETH.
Bearish Scenario — Continuation to $2,026
If ETH holds below $2,385.23 while exchange balances remain elevated above 6.03 million ETH, the pattern’s measured projection to $2,026.94 — and the broader $2,000 target — remains the primary directional read. A sustained close below $2,310.73 accelerates that timeline.
Bullish Scenario — Reclaim of $2,385
A confirmed daily close back above $2,385.23, accompanied by a reversal in exchange balances (ETH moving off exchanges) and stabilization in whale holdings above 26.05 million ETH, would invalidate the immediate bearish structure and open a retest of $2,469.78.
Three independent signals — a $100 billion volume fakeout at $2,400, 160,000 ETH in whale distribution worth $348 million, and 100,000 ETH in rising exchange supply worth $240 million — have converged simultaneously with a confirmed daily chart breakdown below $2,385.23. ETF outflows totaling $276.4 million over five days confirm the institutional read. Martinez’s downside target of $2,026.94 on the chart and the broader $2,000 level are the levels the market is now pricing toward. Watch $2,385.23 — a sustained daily reclaim there is the only near-term data point that disrupts the current bearish structure.
Disclaimer: The views and analysis presented in this article are for informational purposes only and reflect the author’s perspective, not financial advice. Technical patterns and indicators discussed are subject to market volatility and may or may not yield the anticipated results. Investors are advised to exercise caution, conduct independent research, and make decisions aligned with their individual risk tolerance.
Also Read: ETH Smart Trader 0xe813 Opens $45.34M 25x Long With 100% Win Rate