Ethereum Classic price prediction chatter is heating up fast after ETC blasted through a trendline it had been stuck under for over a year, doing it with a volume candle that is impossible to
Ethereum Classic price prediction chatter is heating up fast after ETC blasted through a trendline it had been stuck under for over a year, doing it with a volume candle that is impossible to miss on the weekly chart.
Traders who had written this coin off are suddenly paying attention again.
Levels below come from the weekly timeframe and should be rechecked if the price closes meaningfully outside the stated range.
ETC Price Right Now
Metric
Value
CMP (ETC/USDT Perpetual)
$8.23
24h Change
+16.74%
Market Cap
$1.31B
Futures Volume (24h)
$448.97M
Spot Volume (24h)
$67.40M
Open Interest
$96.53M
Circulating Supply
157.92M ETC
Total Supply
210.70M ETC
Max Supply
210.70M ETC
Futures volume of $448.97M running well ahead of spot volume of $67.40M shows this breakout is being driven mostly by leveraged traders rather than spot buyers.
Chart source: TradingView, ETC/USDT, 1-week timeframe, Binance, captured August 22, 2026. Data source: CoinGlass, captured August 22, 2026.
Trader Spotlight: 2R and Counting
Trader Christopher Inks flagged this move already sitting over 2R, with a follow-through target of $16.670 that would push the trade to 21.56R if it plays out.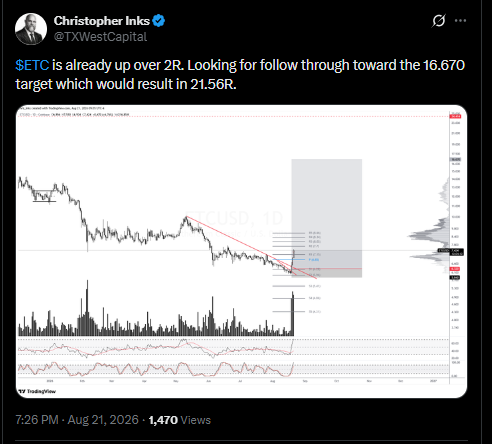
Source: Christopher Inks (X/Twitter), August 21, 2026, 7:26 PM.
Ethereum Classic Liquidation Data Today
The pattern here is worth noting carefully.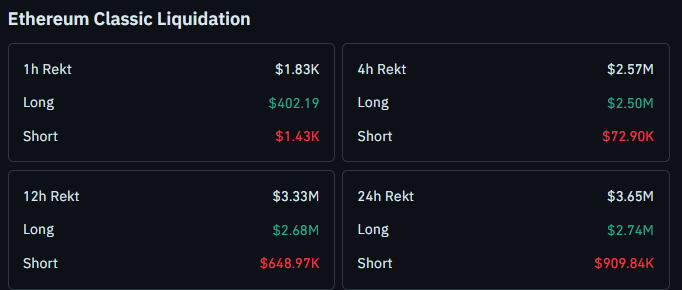
Over the 4h, 12h, and 24h windows, long-side liquidations are dominant, suggesting a shakeout hit longs earlier before the breakout candle formed.
In just the last hour, that has flipped, with short-side liquidations now leading, matching the fresh push higher.
Source: CoinGlass, liquidation data, captured August 22, 2026.
Ethereum Classic Key Takeaways
ETC broke a weekly descending trendline on a huge volume candle
A close above $10.08 opens the next resistance zone at $18.85, then $25.90, then $39.94
A close below $7.19 shifts focus to $6.02 support
Longs were shaken out earlier in the day, but shorts are now the ones getting squeezed as price pushes higher
A trader is already tracking this as a 2R-plus move with a $16.670 follow-through target
This is a leveraged, fast-moving setup. Treat these levels as reference points, not guarantees.
Ethereum Classic Weekly Chart Analysis
Price has spent well over a year grinding under a descending trendline that traces back to its last major top.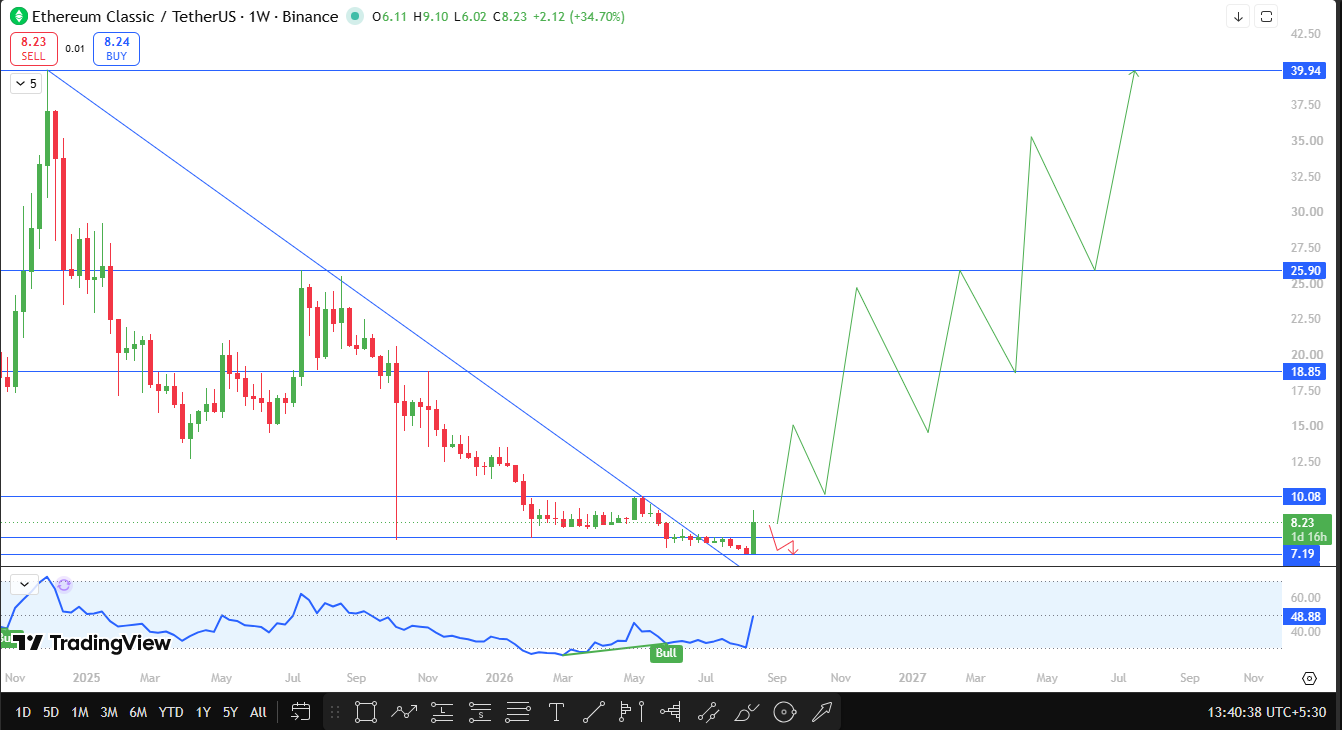
That trendline just broke, and it broke with a volume candle large enough to stand out on the weekly timeframe, which is usually a sign that real conviction, not just noise, is behind the move.
The next test is $10.08. A close above it with continued volume opens the door to $18.85, then $25.90, and $39.94 further out, all levels that lined up with prior swing structure on this chart.
If price instead fails to hold this breakout and closes back below $7.19, the next support to watch is $6.02.
Ethereum Classic Technical Outlook Snapshot
Indicator
Reading
Signal
Price Structure
Weekly descending trendline breakout
Bullish
Momentum Oscillator (TradingView Bull/Bear tag)
48.88, tagged Bull
Bullish
Volume on Breakout
Sharp weekly spike
Bullish
Liquidation Shift (1h)
Short-side now leading
Confirms fresh squeeze
Ethereum Classic Support and Resistance Levels to Watch
Type
Level
% From CMP
Resistance
$39.94
+385.30%
Resistance
$25.90
+214.70%
Resistance
$18.85
+129.04%
Resistance
$16.670
+102.55%
Resistance
$10.08
+22.48%
Current Price
$8.23
0%
Support
$7.19
-12.64%
Support
$6.02
-26.85%
Risk-Reward Table
Case
Trigger
Target
Bull Case
Close above $10.08
$18.85, then $25.90, then $39.94
Base Case
Consolidation between $7.19 and $10.08
Range-bound before the next move
Bear Case
Close below $7.19
Retest of $6.02
Setup Invalidation
Sustained close below $7.19
Bullish structure weakens.
Invalidation Level
The bullish read holds as long as $ETC stays above $7.19 on a weekly closing basis.
A sustained close below that level would invalidate the breakout thesis, with $6.02 as the next reference support.
Planned Update
This piece will be revisited if if closes a weekly candle above $10.08 or below $7.19, whichever comes first.
CoinGabbar's Technical Analyst View
Bull Case: The trendline breakout on strong volume, paired with a fresh squeeze on short-side liquidations, supports continuation toward $10.08 and beyond toward $18.85.
Base Case: A pause between $7.19 and $10.08 would be a normal cooldown after such a sharp move without breaking the structure.
Bear Case: A close back below $7.19 would undercut the breakout and shift focus toward $6.02.
Disclaimer
This article is for informational purposes only and should not be considered financial or investment advice. Cryptocurrency markets, particularly leveraged derivatives, are highly volatile and carry substantial risk of loss. CoinGabbar and the author do not hold a position at the time of publication. Readers should conduct their own research and consult a qualified financial advisor before making any investment decisions.