Ethereum is trading near $2,377, down 1.12% on the day. That is a drop of about $26.93. The coin sits close to key support, and traders are watching the Fed meeting on Oct. 28. Short-term mom
Ethereum is trading near $2,377, down 1.12% on the day. That is a drop of about $26.93. The coin sits close to key support, and traders are watching the Fed meeting on Oct. 28.
Short-term momentum looks weak. The bigger trendline is still holding, for now.
Why Is Ethereum Down Today?
On-chain tracker Lookonchain flagged a sale by an early holder. The investor sold 1,000 ETH, bought at $0.31 during the ICO. At today's level, that is about $2.38 million.
One sale does not move a $290.19 billion market with 122.15 million ETH in supply. Still, more early holders cashing out could hurt mood. Heavy long liquidations added to the pressure.
Are Ethereum ETFs Seeing Inflows or Outflows?
As per SoSoValue data, US spot ETH ETFs went back to net inflows on Oct. 23, per SoSoValue. They took in $4.35 million, after $110.5 million left a day earlier.
Fund
Oct. 23 Net Flow
All spot ETH ETFs
+$4.35M
Fidelity FETH
+$3.58M
Morgan Stanley MSSE
+$773,440
BlackRock ETHA, ETHB and Grayscale ETH, ETHE
$0
The inflow is small. It does not cancel the earlier outflow.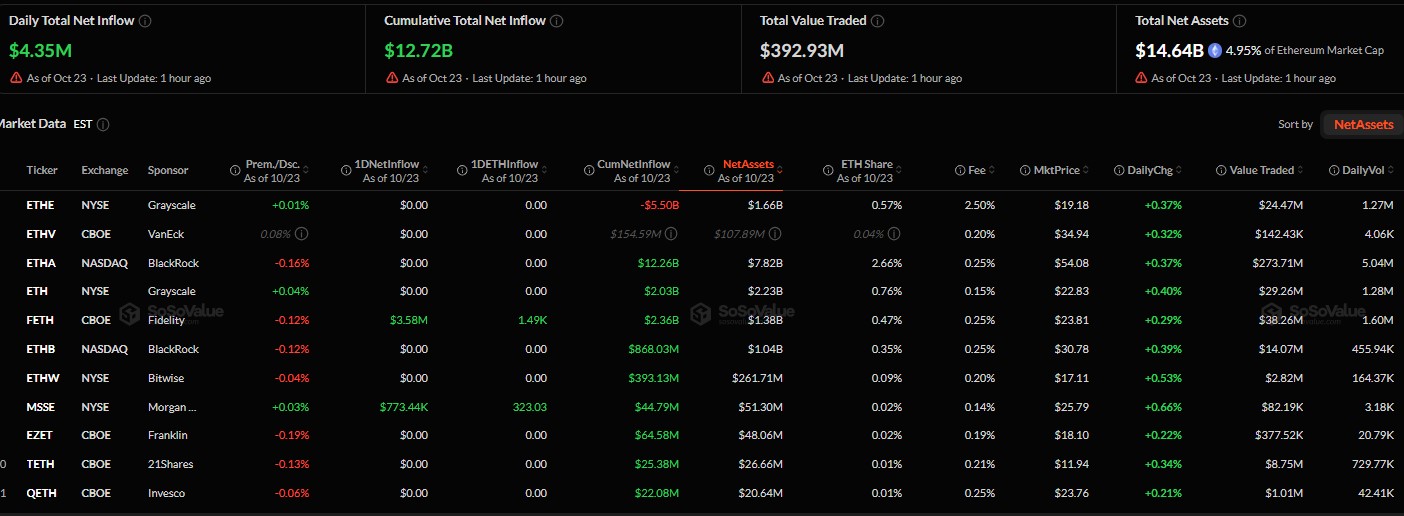
What Is the ETH Long/Short Ratio Today?
The 24-hour ratio is 0.9724, a slight lean toward shorts. Many accounts are still long, though. Binance shows 3.0984, and OKX shows 2.55.
Top trader accounts read 2.4602, but top trader positions read 1.6051. Bigger players are less one-sided.
Trading is also cooling. Spot volume is $1.69 billion.
Metric
Value
Change
Futures volume
$26.10B
-33.27%
Open interest
$30.72B
-1.60%
Options volume
$1.59B
-18.89%
Options open interest
$6.45B
-3.95%
How Much ETH Was Liquidated in 24 Hours?
Longs took most of the pain. Of the $60.80 million wiped out in 24 hours, $50.32 million was long. That is about 83%.
Window
Total
Long
Short
1 hour
$133.73K
$102.16K
$31.57K
4 hours
$505.52K
$119.62K
$385.91K
12 hours
$41.17M
$38.21M
$2.96M
24 hours
$60.80M
$50.32M
$10.47M
In the last four hours, shorts took the bigger hit. The mood is mixed.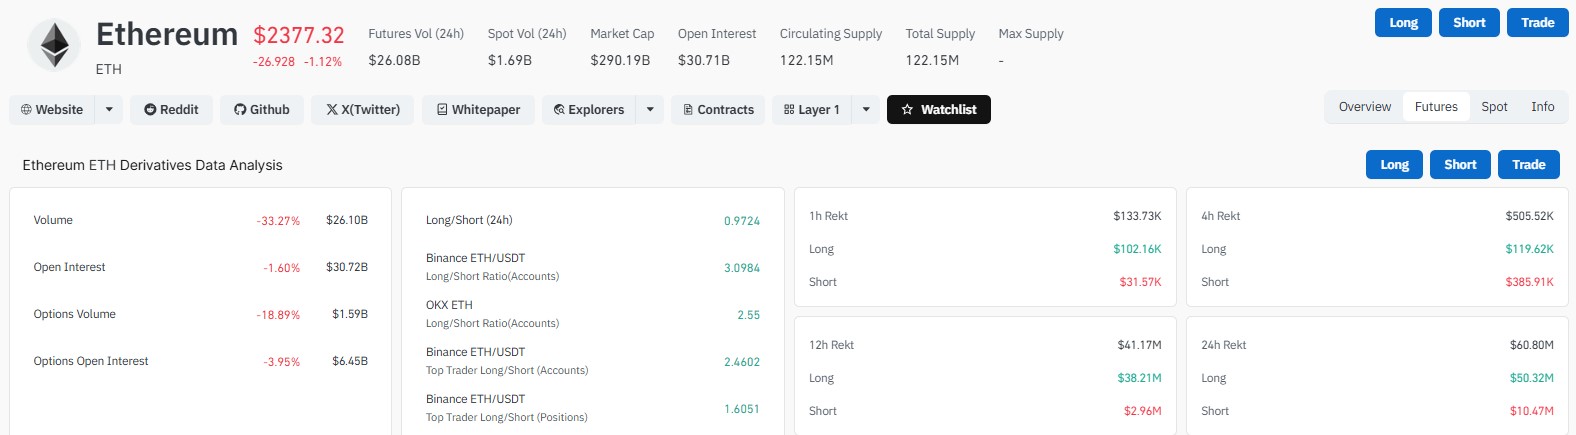
Is ETH Bullish or Bearish Right Now?
On the daily chart, ETH trades at $2,380.50. Today's range runs from $2,369.80 to $2,390.24. The coin rallied from a $1,500 low to near $2,800 before pulling back.
The 20-day EMA is $2,468.18, and the 50-day EMA is $2,470.83. Both sit above price as resistance. The 100-day EMA is $2,364.92, and the 200-day EMA is $2,318.94. A rising trendline runs through the same area.
RSI reads 37.95, with its signal line near 39.91. That points to weak momentum and favors sellers for now.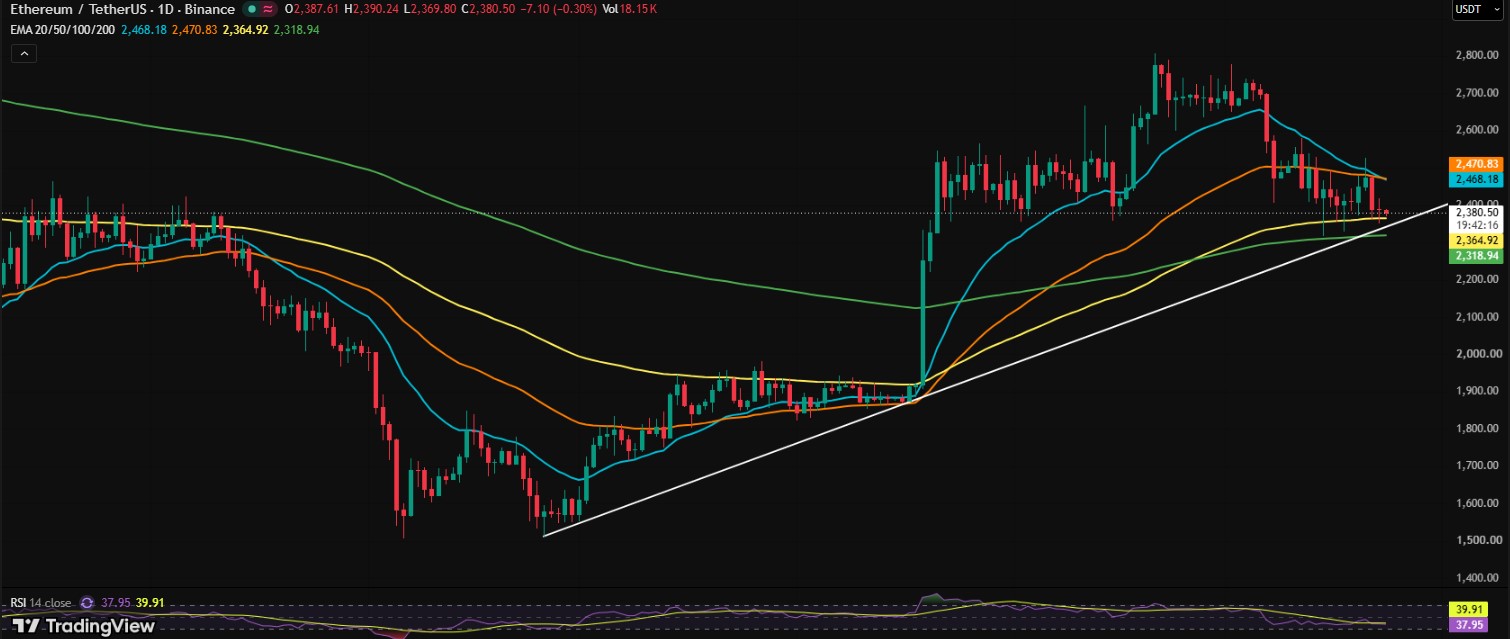
What Are the Key ETH Support and Resistance Levels?
Level
Type
Note
$2,550 to $2,600
Resistance
Recovery area
$2,470
Resistance
20- and 50-day EMA
$2,364.92
Support
100-day EMA
$2,350 to $2,320
Support
Trendline and 200-day EMA
$2,250
Support
Next level down
$2,200
Support
Deeper level
How Will the Fed Rate Decision Affect ETH?
The Fed meets on Oct. 28. The rate sits at 3.75% to 4.00%. Fed futures show a 90% chance of no change and a 10% chance of a hike. Easing odds are 0%.
Hike odds were 70.9% a month ago and 15.5% a week ago. But they rose from 5.5% a day ago.
Higher rates often weigh on risk assets like crypto. A calm meeting could help. Neither is guaranteed.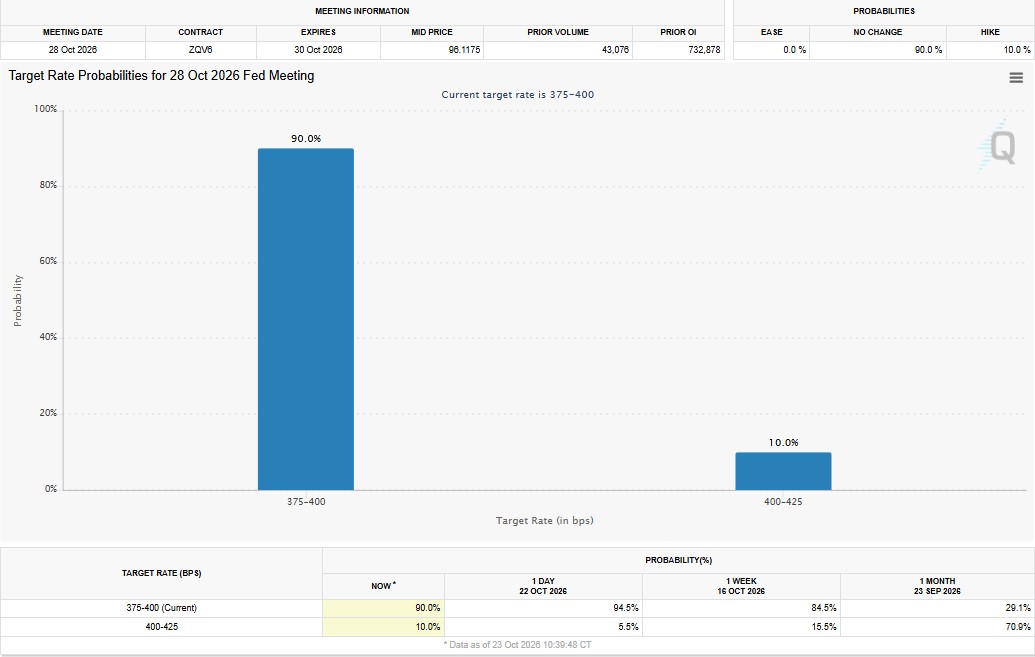
Will ETH Go Up or Down This Week?
Scenario
Trigger
Possible Area
Bullish
Trendline holds, move above $2,470
$2,550 to $2,600
Neutral
Range trade
$2,320 to $2,470
Bearish
Daily close below $2,320
$2,250, then $2,200
ETH looks vulnerable unless it reclaims $2,470. A clean break under $2,320 would strengthen the bearish case. Nothing is certain, and the Fed result could change things fast.
Disclaimer
This article is for information only and is not financial advice. Crypto is volatile, and you can lose money. Do your own research and speak with a licensed advisor before investing.