Ethereum price crossed $2,000 this week for the first time since early June. The move came after a sharp 17.73% daily jump that caught many traders off guard. ETH touched an intraday high nea
Ethereum price crossed $2,000 this week for the first time since early June. The move came after a sharp 17.73% daily jump that caught many traders off guard.
ETH touched an intraday high near $2,103 before pushing further to around $2,254 on the daily chart. At the time of writing, Ethereum's market cap stood near $270.38 billion, with spot volume over 24 hours at $6.50 billion. Circulating supply sits at 120.68 million ETH.
The rally lines up with Bitcoin's own climb toward $70,000 and a broader wave of short liquidations across the crypto market.
The move came fast. A wave of short liquidations, easing bond yields, and fresh regulatory chatter out of Washington all hit at once.
Now the question on everyone's mind is simple. Can Ethereum hold this level, or is a pullback coming next?
What Is Driving Ethereum's Price Today?
A few things came together at once.
The US Treasury doubled its long-term bond buybacks. That move improved liquidity expectations across risk assets, and crypto caught the wave.
At the same time, spot Ethereum ETFs pulled in $189.15 million in net inflows. BlackRock's ETHA fund led the way with $122.12 million of that total.
Short sellers also got squeezed hard. CoinGlass data showed roughly $15.70 million in positions liquidated within a single hour, with about $2.21 million of that coming from short positions alone.
Over 24 hours, total liquidations reached close to $1.13 billion. Short positions made up the bulk of it at $1.02 billion, while longs accounted for $105.44 million.
Is Ethereum Overbought Right Now?
Yes, and the charts back that up.
On the daily ETH/USDT chart, the Relative Strength Index sits near 82. That is well into overbought territory, and it often signals a cooling-off period after a sharp move.
Ethereum broke above its 20, 50, 100, and 200 EMA cluster during this rally. That is normally a bullish signal, but stretched RSI readings like this one can lead to short-term pullbacks even inside an uptrend.
A retest of the $2,100 to $2,200 zone would not be unusual before the next leg higher, if there is one.
Ethereum Exchange Supply Keeps Falling
There is a quieter trend running underneath the price action.
According to Santiment data, ETH supply on exchanges dropped from about 7.70 million coins on June 2 to roughly 6.54 million by August 18. That is close to 1.15 million coins pulled off exchanges, or about 15% in eleven weeks.
Bitcoin moved the opposite way over the same stretch, with exchange balances rising about 1.8% between July 28 and August 18.
Falling exchange supply often points to holders moving coins into cold storage or staking rather than preparing to sell. Ethereum staking levels are reportedly near record highs, and corporate treasuries continue adding ETH, with BitMine alone said to hold close to 5% of total supply, most of it staked.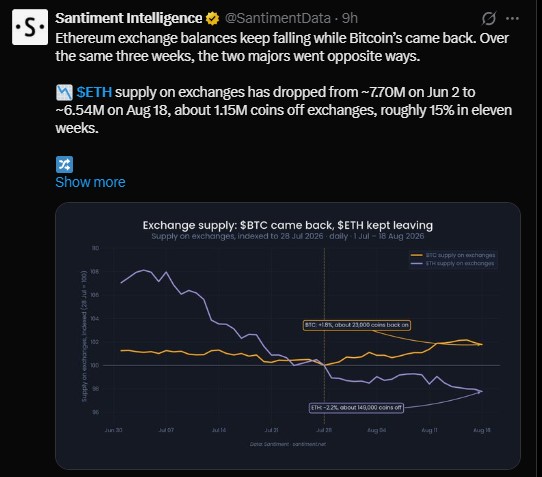
Ethereum Derivatives Market Heats Up
Futures and options activity has jumped sharply alongside the price move.
Metric
24h Change
Current Value
Futures Volume
+377.58%
$103.51 billion
Open Interest
+15.59%
$30.21 billion
Options Volume
+371.11%
$3.10 billion
Options Open Interest
+15.19%
$6.40 billion
Long/Short Ratio
—
1.082
The long/short ratio above 1 shows traders are leaning slightly bullish for now, though the gap is not huge.
A closer look at exchange-level positioning shows retail accounts leaning even more bullish than the broader market. On Binance, the ETH/USDT long/short account ratio stands at 2.252, while OKX shows 1.15. Binance's top trader accounts show a long/short ratio of 1.2477, and by position size that ratio rises to 1.4036.
Liquidation data also shows how fast things moved. In the hour before this snapshot, $1.40 million in longs and just $60.86K in shorts were liquidated.
Over four hours, long liquidations reached $13.11 million against $2.04 million in shorts. Stretched to 12 hours, shorts flipped hard, with $557.78 million in short liquidations against $57.28 million in longs, showing how the squeeze accelerated as the rally built momentum.
Ethereum Price Prediction: What Are the Key Levels?
Based on the daily chart structure, a few levels stand out.
Scenario
Price Zone
What It Means
Immediate resistance
2,350–2,450
First target if momentum holds
Extended target
2,600–2,700
Possible if daily close clears $2,400
Breakout retest
2,100–2,200
Likely pullback zone given high RSI
Support to watch
$2,000
Losing this weakens the bullish case
Bearish scenario
1,900–2,000
Return zone if $2,000 fails to hold
The weekly chart tells a longer story too. This week's candle opened at $1,876.01, ran as high as $2,333.65, and closed around $2,252.01, a weekly gain of roughly 20.04%.
ETH has been building a rising trendline since 2022, with price recently pushing back above the 20-week EMA near $2,020 after months of lagging behind it.
That said, Ethereum remains far below its earlier 2025 highs near $4,800, and the weekly RSI at 54.34 shows there is still plenty of room before anything looks stretched on that timeframe.
Ethereum Price Prediction: Bullish or Bearish Case?
The bullish case rests on continued ETF inflows, falling exchange supply, and strong staking demand. If Ethereum closes above $2,400 on the daily chart, traders will likely watch $2,600 to $2,700 next.
The bearish case is just as real. RSI near 82 on the daily chart is a warning sign. A drop back below $2,000 on a daily closing basis would weaken the breakout story and open the door toward the $1,900 zone again.
Nothing here is guaranteed. Markets can turn quickly, especially after moves this sharp.
Disclaimer
This article is for informational purposes only and does not constitute financial, investment, or trading advice. Cryptocurrency markets are highly volatile and carry significant risk. Always do your own research and consult a licensed financial advisor before making investment decisions.