"Wicks lie, closes don't." Every trading chat says it, so we counted. When price wicked through yesterday's high or low and the 4h candle closed back inside the range, price was still inside
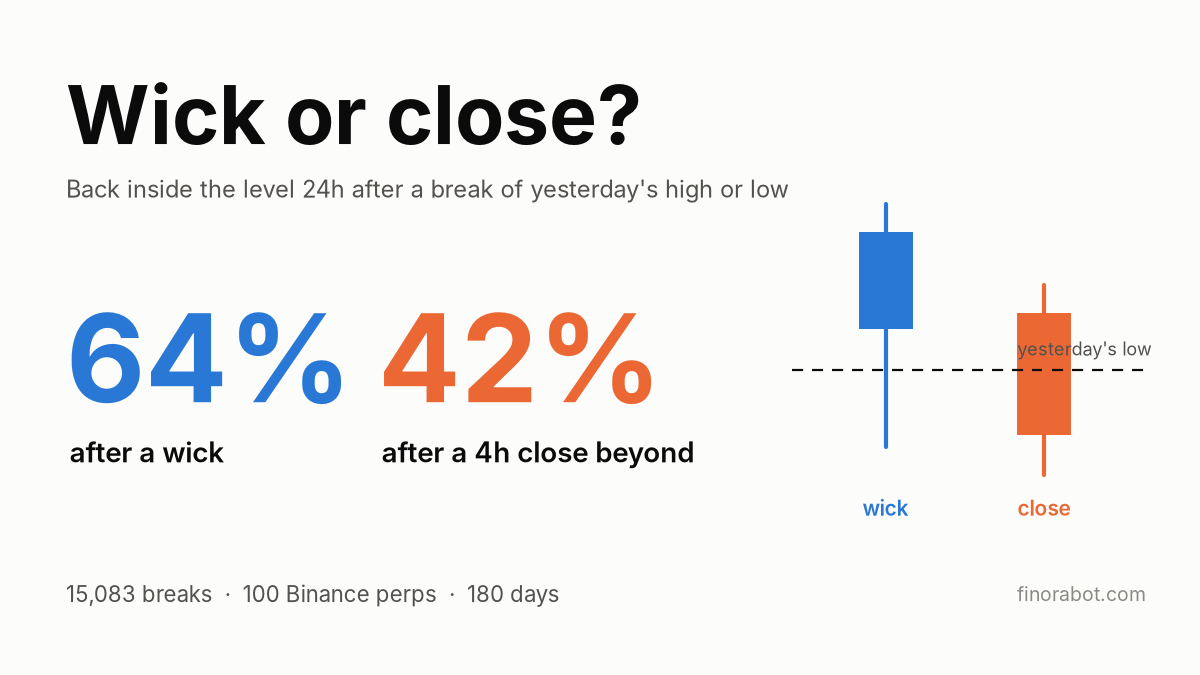
"Wicks lie, closes don't." Every trading chat says it, so we counted. When price wicked through yesterday's high or low and the 4h candle closed back inside the range, price was still inside a day later 64% of the time. When the 4h candle closed beyond the level, only 42% came back. After two closes in a row, 32%.
That looks like a clean win for the close. Then we checked how much of the gap is plain arithmetic. All of it, as it turned out.
The sample: the 100 most traded Binance USDT-M perpetuals by 24h volume on 21 November 2026, minus stablecoins, gold tokens and stock perps, all listed for the whole window. Hourly candles from 25 May to 20 November 2026 (180 days), from Binance's public API.
The level is the one on everyone's chart: the previous UTC day's high and low. For each coin and day we took the first 4h candle that traded beyond each of them.
Then one check: 24 hours after that candle closed, was price back inside the level or still beyond it?
Lows and highs are pooled, because $BTC fell about 24% over the window and lows alone would flatter the breakdown side. The first 14 days only calibrate candle sizes, so breaks count from 8 June to 19 November.

Share of first breaks of yesterday's high or low that were back inside the level 24h later, by how the 4h candle closed
Fewer than half of the first breaks (45%) closed beyond the level. The rest were wicks.
The split showed up everywhere we looked. Lows: 61% of wicks back inside vs 40% of closes. Highs: 68% vs 44%. $ETH alone: 66% vs 43%. In all 100 coins, closes came back less often than wicks.
A close beyond the level means the next 24 hours start with price already on the far side. A wick means they start back inside. Nothing special has to happen for that to survive a day.
So we gave every break a yardstick: if price had simply wandered from where the 4h candle closed, with that coin's normal 24h swings over the previous 30 days and no memory of the level, how often would it end up back inside? That model expected 62% of wicks and 37% of closes back inside, a bigger gap than the 22 points we measured. A second version, using each coin's swings over the last 24 hours, expected about the same gap we measured.
The close told us where price was, and little beyond that. That's also why the split held in all 100 coins. Wicks came back about as often as the model expected, and closes a few points more often (42% vs 37%). If a close meant the market had accepted the new price, closes should have come back less often than that, not more.

Back inside the level 24h later, by how far beyond the level the 4h candle closed: measured vs a random-drift model starting from the close
Depth of the close tells the same story. We measured the close's distance past the level in that coin's typical 4h candles (the median high-to-low range of its previous 14 days, about 0.9% for BTC). Closes within a tenth of a candle came back 51% of the time, closes more than a full candle beyond 29%. Distance alone predicted most of that slope.
The deep end was the exception: those closes came back far more often than the model expected (29% vs 16%). Bigger swings after a huge candle explain part of it, but even allowing for them, the model expected only about one in four to come back.
When a close was reclaimed by the very next 4h candle, 64% were back inside a day after the reclaim. Same as a wick and close to the model's 63%: price was back where a wick leaves it, and behaved like one.
Not a free pass, though. The most recent BTC break in our data: on 19 November a 4h candle closed at 61,959, just under the previous day's low of 62,031, and the next one closed back above it at 62,126. Textbook fake-out. A day later BTC was at 58,915, 4.9% lower.
Two closes in a row came back 32% of the time, measured from the second close, against 30% expected. A second close mostly meant price had moved further from the level.
Within a day, price traded past the wick tip in almost two of every three wicks. Even when the level held and price was back inside 24 hours later, the tip still got tagged almost half the time.
After a close beyond the level, price pushed past the breakout candle's extreme within a day in 81% of cases. But 24 hours after the close, price was further in the break direction only 46% of the time, with a median move of -0.33%, slightly back toward the level. The close did predict which side of the level price would sit on a day later (58% stayed beyond). Trading the close itself was a coin flip at best.
On 1h candles the gap shrank to 12 points (60% vs 48%), again no more than the model expected (14 to 16 points): a 1h candle can't close as far past the level.
None of this is a system. It's the checklist we now run before trusting a break:
Mark yesterday's high and low on the UTC daily candle (00:00 to 00:00 UTC).
Wait for the 4h candle to close before calling the break.
Read the close as a position report: it tells you where price is, not much more.
Compare how far beyond it closed with a normal 4h candle on that coin. A sliver beyond came back about half the time, between a wick and an average close.
Check the next 4h candle. A close straight back inside put the odds back at wick levels.
If your stops sit just past wick tips, count how many of your last 20 or 30 got tagged within a day.
A mostly falling market. Highs came back inside more often than lows, but the wick vs close gap was similar on both sides.
Breaks cluster. On the median day, 51 of the 100 coins traded below yesterday's low, so the 15,083 breaks aren't 15,083 independent tests. When we resampled whole days, the 4h gap still landed between 19 and 26 points in 95% of runs, and closes still came back 2 to 9 points more often than the model expected.
The expected figures come from a simple drift model: a yardstick, not a law.
We tested one kind of level, only the first break each day, and only 24 hours ahead.
"Back inside" isn't a trade result (no fees, funding or slippage), and a top-100 list from one day leans toward survivors.
We build Finora, a Telegram bot: send a pair and timeframe and it marks the entry, targets and the level that would invalidate the idea. It counts that level as broken only on a candle close, so a wick alone doesn't kill the setup. Try it here:
https://t.me/FinoraEN_Bot?start=ad_cmcart1
Our longer write-up on liquidity sweeps:
https://finorabot.com/blog/what-is-a-liquidity-sweep/?r=cmc
Our CMC profile posts short chart reads daily using the same level logic.
Not financial advice.