World Liberty Financial has spent weeks squeezing into a tighter and tighter range, and this WLFI price prediction is built around the exact moment that squeeze is about to end. Traders who'v
World Liberty Financial has spent weeks squeezing into a tighter and tighter range, and this WLFI price prediction is built around the exact moment that squeeze is about to end.
Traders who've been watching this setup know the boring part is almost over.
What happens next depends on which side of the pattern gives way first, and the data below lays out both paths.
World Liberty Financial: What This Token Actually Is
WLFI is the native token of World Liberty Financial, an ERC-20 asset that runs on Ethereum with its contract deployed through a proxy structure, meaning the underlying code can be upgraded by the project team without changing the token's address.
That's a fairly common setup for DeFi-linked projects, though it's worth knowing since it does concentrate some control in the development team's hands.
The token currently has a maximum total supply of roughly 96.74 billion WLFI.
Not all of that is circulating yet, which is why you'll see two different market cap figures floating around more on that in a second.
WLFI Price Today: Where Things Stand Right Now
At the time of writing, WLFI is priced at $0.06, quoted at roughly 0.000030 ETH, up about 2.80% against its ETH pair.
Two market cap numbers matter here, and people mix them up constantly:
On-chain market cap (based on max supply): approximately $5.64 billion
Circulating supply market cap: approximately $1.85 billion
That gap tells you a large chunk of WLFI's total supply isn't in free float yet.
Worth remembering before anyone throws around a fully diluted price target: the math changes a lot depending on which supply figure you use.
Holder count sits at 99,914 wallets, ticking up slowly (+0.001% recently). Growth is there, just not explosive.
WLFI Liquidation Data: Who's Getting Squeezed
As per Coinglass, liquidation data shows which side of the trade has been getting hurt lately, and right now it's leaning one direction pretty clearly: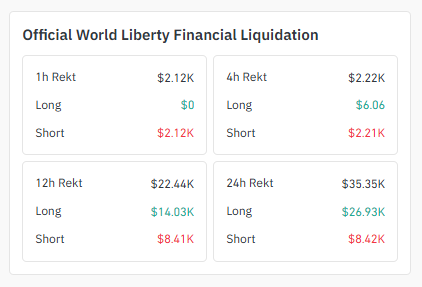
1-hour: $2.12K total liquidated all of it ($2.12K short, $0 long)
4-hour: $2.22K total, again almost entirely shorts ($2.21K short vs $6.06 long)
12-hour: $22.44K total, $14.03K long, $8.41K short
24-hour: $35.35K total, $26.93K long, $8.42K short
That short-heavy wipeout on the 1-hour and 4-hour windows fits with the push toward the top of the descending channel.
Shorts got caught leaning the wrong way during the recent World Liberty Financial bounce.
But zoom out to 24 hours and longs have actually taken the bigger hit overall, which tells you this hasn't been a one-directional squeeze.
Both sides have been punished depending on timing.
That's fairly typical WLFI liquidation data behavior for a token stuck inside converging trendlines with false breaks in both directions until the real one shows up.
WLFI Exchange Volume Heatmap: Where the Trading Lives
Futures volume for WLFI is heavily concentrated on a handful of venues: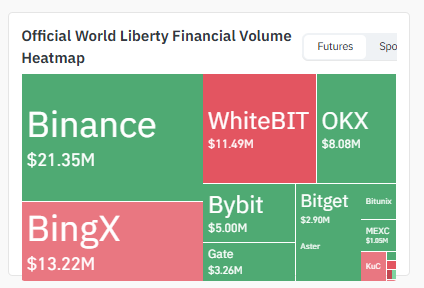
Exchange24H Futures VolumeBinance
$21.35MBingX
$13.22MWhiteBIT
$11.49MOKX
$8.08MBybit
$5.00MGate
$3.26MBitget
$2.90MBitunix, MEXC, KuCoin & Others
Under $2.00M eachBinance WLFI volume alone accounts for the largest single share, which usually means price discovery and liquidity depth are strongest there.
If you're watching for a breakout confirmation, that's the order book to lean on.
WLFI Holder Data Check: Whales Hold 99% of the Supply
This is the section that matters more than most people give it credit for. On-chain data shows serious concentration:
The top 100 wallets hold 98.74% of the supply
Whale concentration sits at 99.26%, even though whales make up only 0.21% of all holders
Gini distribution score: 0.9991 (a score near 1.0 means extremely uneven distribution)
Just 10 wallets each hold at least 1% of the total supply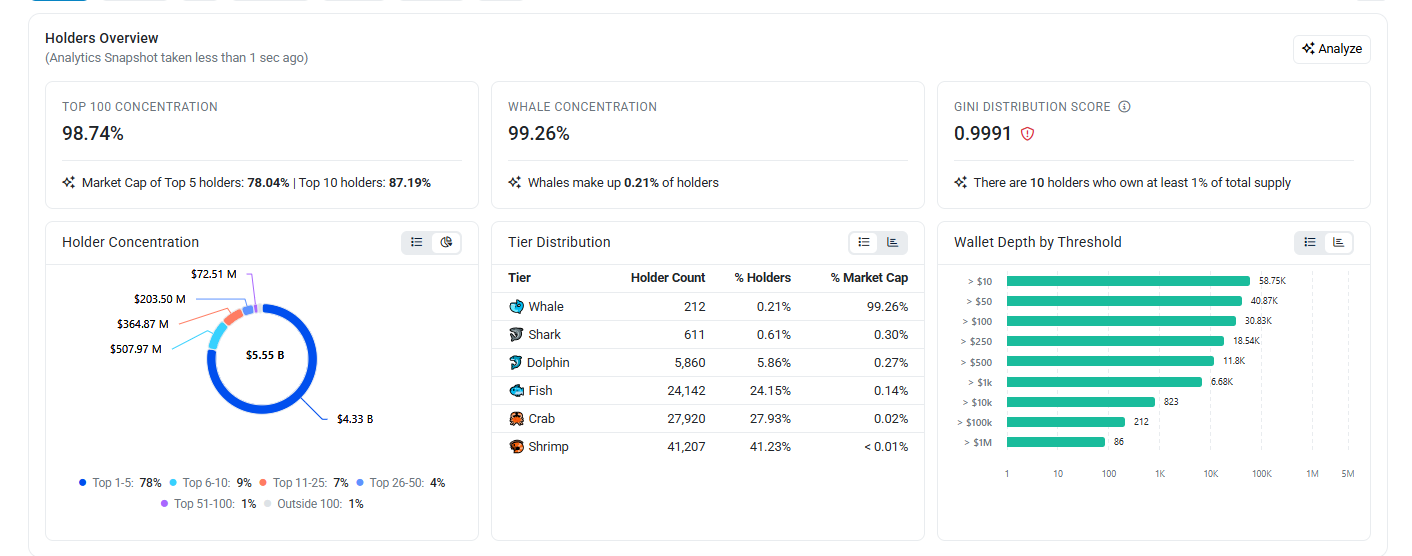
Source:Data Taken From etherscan
Breaking it down by tier:
TierHolder Count% of Holders% of Market Cap
Whale2120.21%
99.26%Shark6110.61%0.30%
Dolphin5,8605.86%0.27%
Fish24,14224.15%0.14%
Crab27,92027.93%0.02%
Shrimp41,20741.23%<0.01%
In plain terms: 212 wallets control basically the entire float.
That's not unusual for a token still early in its distribution curve, but it does mean price can move sharply if even a small handful of those large holders decide to shift positions.
Anyone treating WLFI-holders' data as a footnote is skipping the part of the analysis that usually explains the sharpest candles
WLFI 1-Hour Chart: Inside the Descending Channel
Drop down to the shorter timeframe, and here's the update: World Liberty Financial the price was stuck inside a descending channel for a while, making lower highs and lower lows the whole way down.
That channel has now been broken. The Symmetrical Triangle price has pushed up and out of it. The next part is the retest. 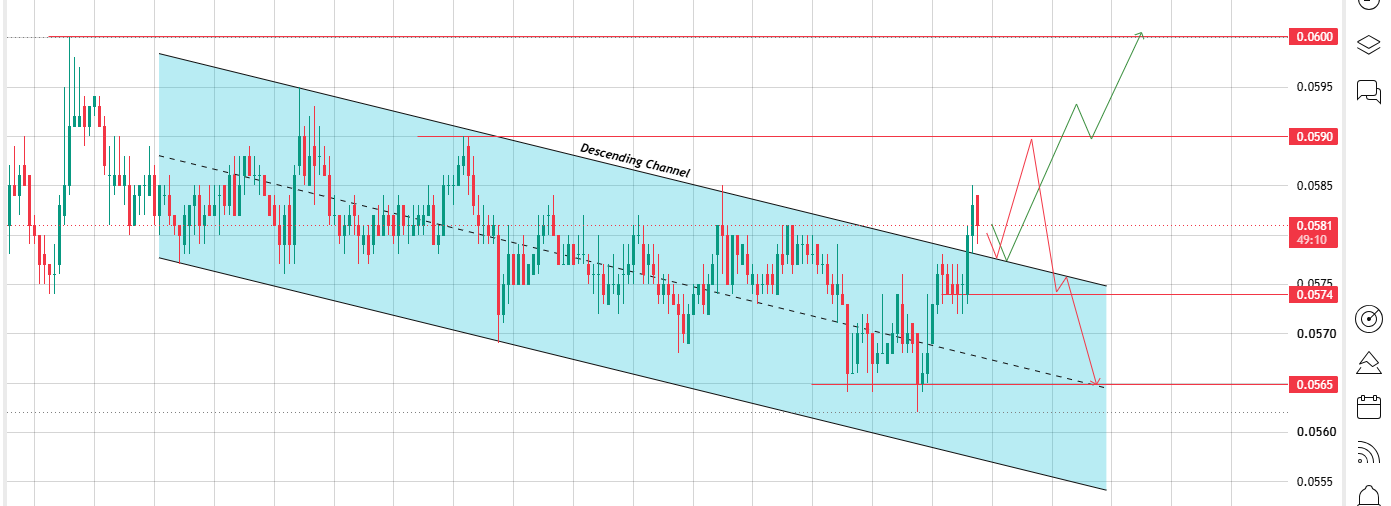
Source: Chart Taken From TradingView.
If the price comes back down, taps the old channel boundary, and holds, that's the green light to keep pushing up toward the higher levels.
If that retest fails instead, a symmetrical triangle means the price can't hold above the broken channel line. A symmetrical triangle expects it to slide back down into the range it just escaped.
The current price is trading around $0.0574–$0.0581, just above the old channel boundary
Immediate resistance on the way up sits at $0.0590, with a second level at $0.0600.
The broken channel line lines up close to the $0.0565 Symmetrical Triangle; that's the retest zone to watch
The retest is the key thing to track here. If the price dips back toward $0.0565, holds above the old channel line, and turns back up, that confirms the breakout and opens the path toward $0.0590 and then $0.0600.
If the retest fails and the price slips back below $0.0565, the breakout gets rejected and the price is back inside the range it just escaped.
WLFI 1-Day Chart: The Triangle Everyone's Watching
Zooming out to the daily chart, the story is a symmetrical triangle, built between roughly $0.07 on top and $0.05 on the bottom over the past few weeks.
Price has now worked its way right up to the apex, the point where both trendlines meet.
That's decision time. Break out and $0.0710 is the next stop. Break down instead and $0.0513 comes into play.
Here's what the daily chart is actually showing: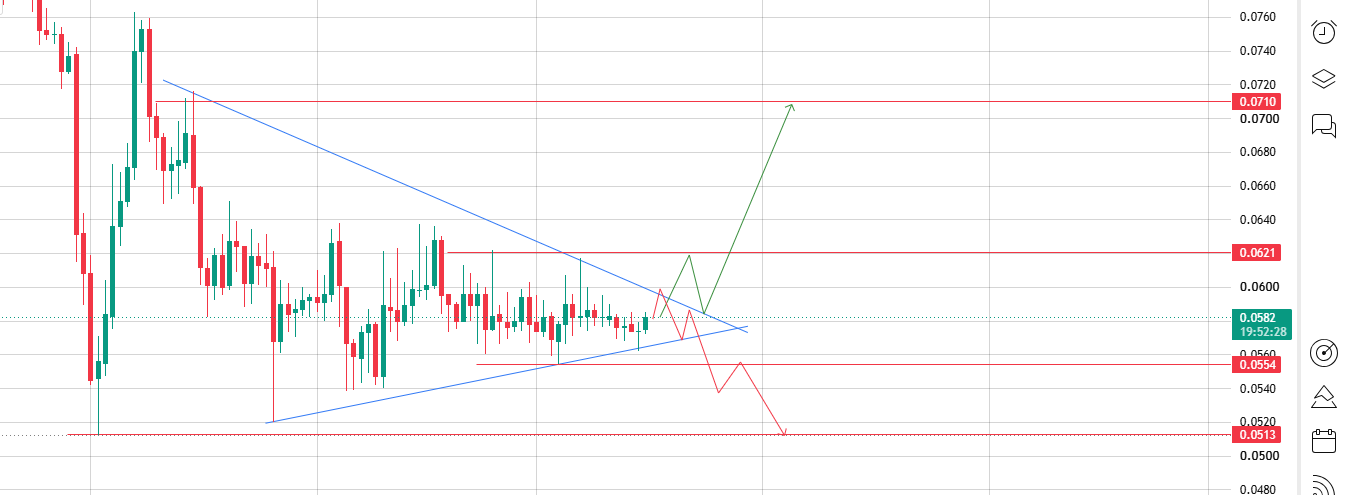
Source: Chart Taken From TradingView.
Price is compressing between a descending resistance trendline (drawn off the highs) and a rising support trendline (drawn off the lows).
The current price near $0.0582 sits right inside that narrowing wedge.
Upside resistance levels:$0.0621, then $0.0710
Downside support levels: $0.0554, then $0.0513
A clean break above the upper trendline with a close over $0.0621 opens the door toward $0.0710.
A breakdown below the lower trendline through $0.0554 points toward $0.0513 as the next real support shelf.
Nothing in between those two outcomes is particularly exciting; it's just more chop.
WLFI Price Prediction: Bull, Base, and Bear ScenariosScenarioTriggerPrice Target
BullishDaily close above $0.0621, confirmed by a break above the $0.0590 channel resistance on the 1-hour chart
$0.0710Neutral / RangePrice stays boxed between $0.0565 and $0.0600; no confirmed breakout either way
$0.0565–$0.0600 chopBearishLoss of $0.0565 channel support, followed by a daily close below $0.0554
$0.0513None of these levels are guesses; they're pulled straight off the trendlines and horizontal levels marked on the charts above.
The WLFI support and resistance zones are tight right now, which usually means the eventual move, once it comes, moves fast.
Risk Factors Every WLFI Trader Needs to Weigh Right Now
A few things worth sitting with before acting on any of the levels above:
Whale concentration risk: With 99.26% of the token held by 0.21% of wallets, a coordinated sell from even a few large holders could break support levels that otherwise look technically solid.
Volatility: Tokens this early in their price history, with supply this concentrated, tend to move harder in both directions than more established assets. Stop-loss discipline matters more here than on a blue-chip pair.
Liquidity fragmentation: Volume is split across seven-plus exchanges. That's healthy for access, but it can also mean price briefly diverges between venues during fast moves.
Pattern invalidation: Every level in this WLFI price prediction is conditional. A triangle breakout that fails and reverses back inside the pattern is a known false-signal risk on any asset, not just this one.
Final Outlook: WLFI, Bitcoin, and the Wider Market
WLFI's setup right now is a classic compression story: narrowing range, shrinking volatility, and a decision point that's getting closer by the day.
The bullish case has some support behind it: shorts have been taking the brunt of recent liquidations on the shorter timeframes, and price has been probing the top of its channel rather than the bottom.
That said, altcoins with this level of whale concentration rarely move in isolation.
A steady or rising Bitcoin generally gives smaller-cap tokens like WLFI more room to attempt a breakout, since risk appetite tends to flow downstream from BTC and ETH into altcoins during calmer macro conditions.
If Bitcoin dominance climbs or the wider market turns risk-off, the bearish path toward $0.0513 becomes more likely regardless of what WLFI's own chart is suggesting.
Keep half an eye on BTC and ETH price action alongside these levels; it's rarely just about the token's own chart in isolation.
Disclaimer: This article is for informational purposes only and does not constitute financial advice. Cryptocurrency markets, especially lower-cap and concentrated-supply tokens like WLFI carry significant volatility and risk. Always do your own research before trading.