Key Takeaways Exchanges disagree on where XRP goes next. No buyers are waiting until the absolute low. Traders are actively cutting back their risk. Falling momentum indicates further room to
Key Takeaways
- Exchanges disagree on where XRP goes next.
- No buyers are waiting until the absolute low.
- Traders are actively cutting back their risk.
- Falling momentum indicates further room to drop.
XRP is trading at $1.24 at the time of writing, down 7% on the week. The TradingView daily chartshows price has broken beneath both the 50-day SMA at $1.3885 and the 100-day SMA at $1.3838, with both moving averages now sitting above current price as resistance. The RSI reads 33.31 on the daily close with the signal line at 38.73 still declining, not yet at oversold extremes but trending in that direction without a stabilizing price structure to anchor it.
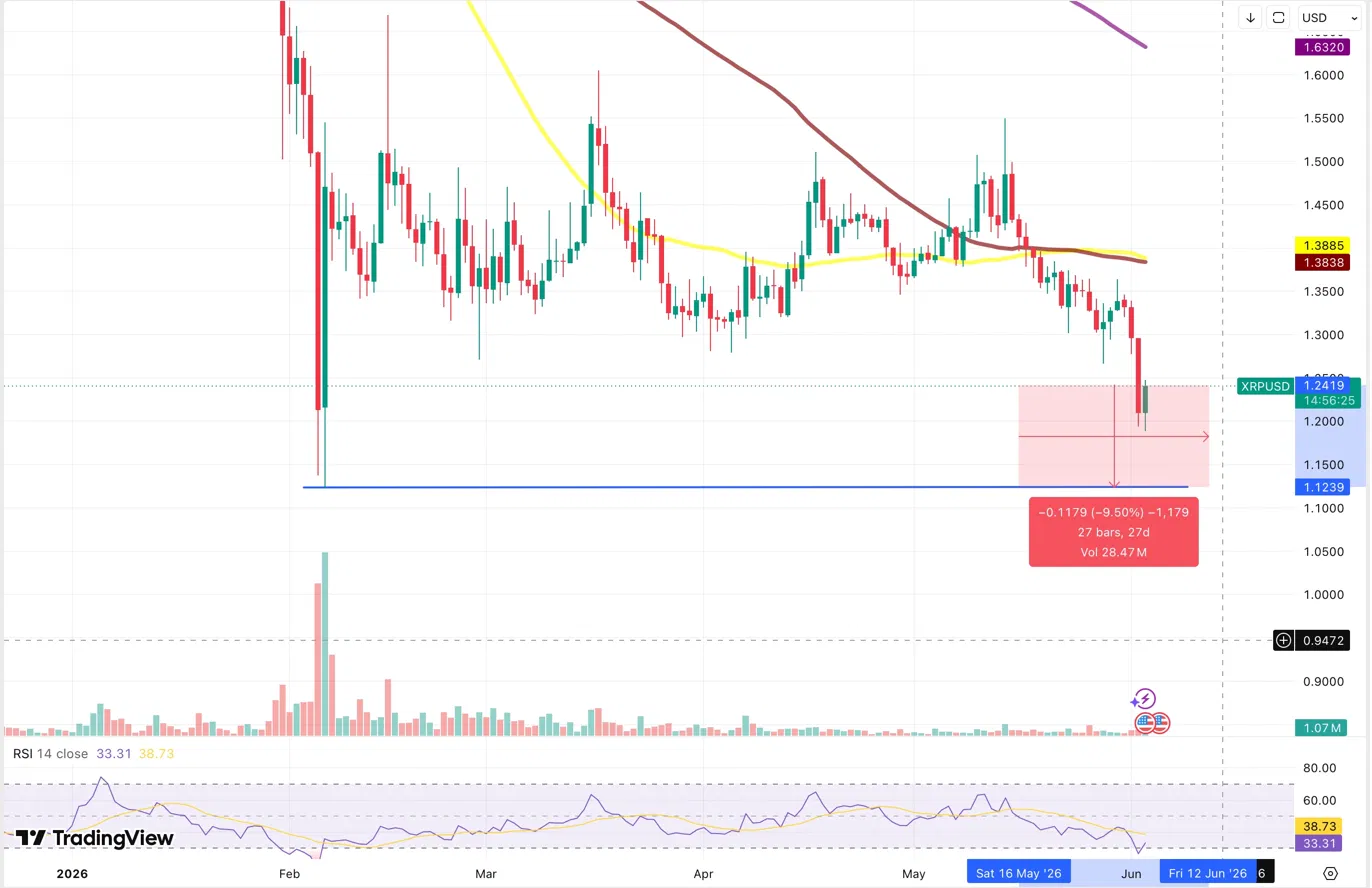
XRP Price Chart from TradingView
The 4-hour Binance perpetual chart, shared by CryptoQuant analyst Amr Taha places current price within a liquidity cluster between $1.20 and $1.13, with the 2026 cycle bottom at $1.1239 visible as the horizontal support at the base of that zone. The distance from current price to that level is approximately $0.12, or roughly 10%. That margin is thin enough that the $1.20 area functions less as a distant target and more as an immediate test, one that the current weekly momentum places within reach without requiring any additional external catalyst.
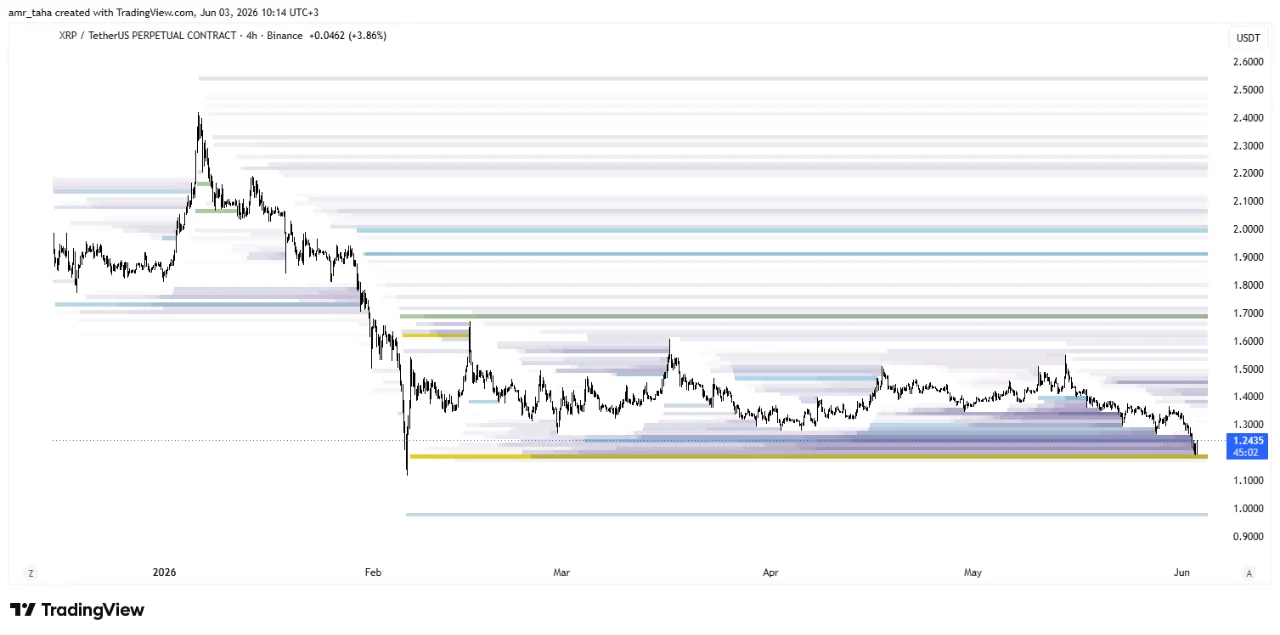
Binance perpetual chart
A Market Splitting at the Wrong Moment
Recent report, shared by CryptoQuant, reveals something more nuanced than a straightforward sell-off. As XRP approached the $1.20 area, the derivatives market began deleveraging, but the pressure landed unevenly across exchanges in a way that tells two different stories simultaneously.
Bybit’s XRP futures positioning contracted sharply. Between May 21 and June 3, roughly $67M in open interest left Bybit’s books, a reduction of nearly 24% in under two weeks.
The pace of that exit accelerated into early June, with the 7-day open interest change hitting approximately -$61M on June 2 and -$56M on June 3.
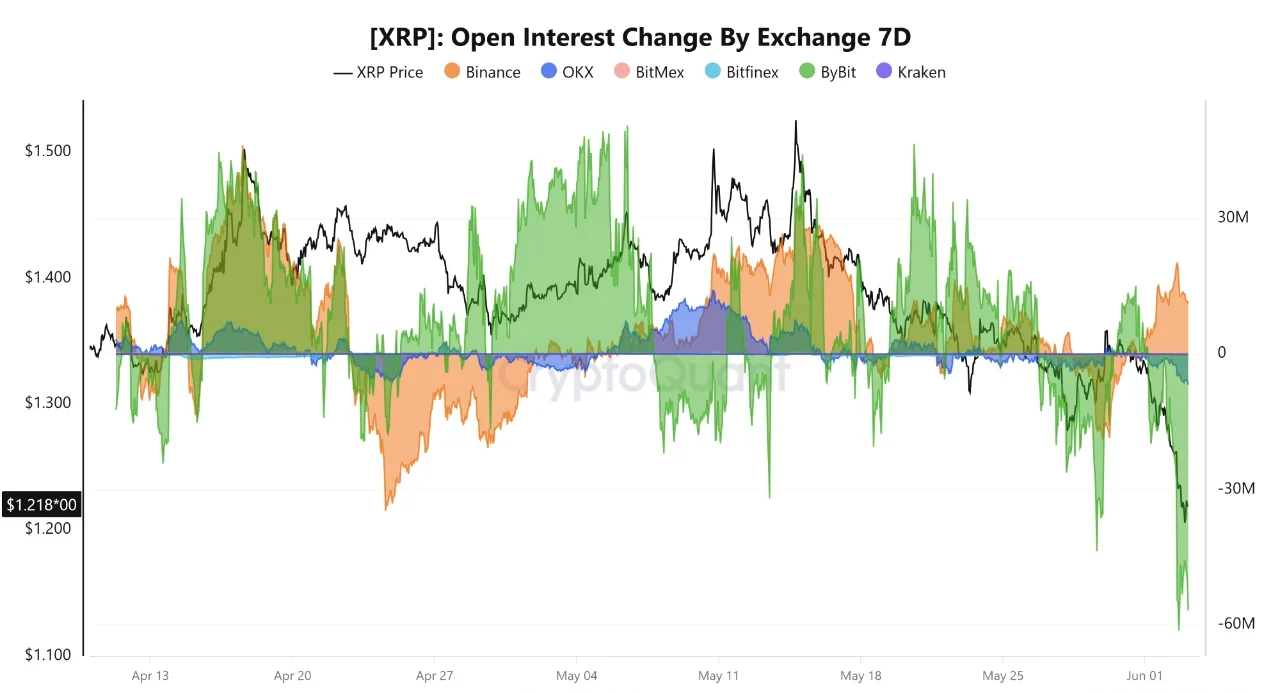
Three consecutive negative delta readings between -$13M and -$23M over that period confirm this was not a single reactive flush but a deliberate and sustained reduction in exposure.
When open interest falls alongside price, it typically means existing positions are being closed rather than new short bets being added. The market is not aggressively positioning against XRP at $1.20. It is retreating from it.
Binance moved in the opposite direction. While Bybit was clearing nearly a quarter of its XRP exposure, Binance added approximately $20M in open interest on June 2. The multi-exchange open interest chart confirms Binance’s layer remained stable and dominant across the full period while Bybit’s contribution visibly compressed.
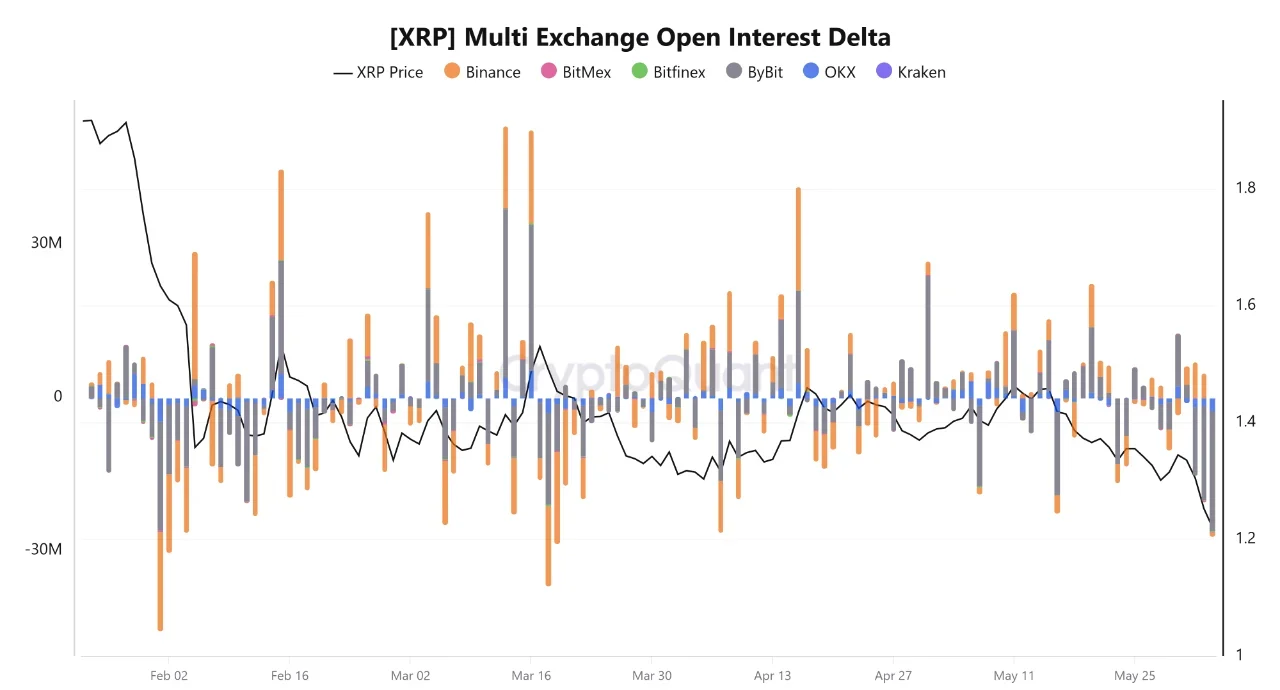
Two major venues, same asset, same price, opposite decisions. That divergence is what makes the current setup structurally ambiguous rather than directionally clear.
What Traders Are Looking For
The split between Bybit and Binance is not just a data curiosity. It reflects genuine disagreement at a price level that carries significant consequences either way. Bybit’s deleveraging reduces the pool of forced sellers that could accelerate a breakdown, which is structurally constructive. But Binance’s maintained exposure means a meaningful volume of open positions still needs to either be vindicated by a price recovery or eventually face its own closure if price continues lower.
What resolves the ambiguity is the $1.20 level and what happens to Binance’s open interest if it is tested. A sustained hold above $1.20 with Bybit’s deleveraging stabilizing suggests the leverage reset is completing cleanly, removing weak hands without triggering a cascade. That is the setup that historically precedes a base formation. A break below $1.20 accompanied by Binance open interest beginning to contract could signal the divergence has collapsed into uniform selling, at which point the $1.1239 cycle bottom could become the only remaining reference with no structural demand between current price and that level, as seen on the daily chart.
READ MORE:
 Charles Schwab Eyes Crypto Spot Trading for Advisors in 2027
XRP Price: Frequently Asked Questions
Will XRP drop to its 2026 bottom?
XRP could test its 2026 bottom of $1.1239 if it breaks below the immediate $1.20 support level. A breakdown past $1.20 leaves no established buyer demand zones to halt the decline, putting the cycle low directly in play.
What is the key support level for XRP right now?
The immediate key support level for XRP is $1.20. If this level fails to hold, the next major structural support sits at $1.1239, which represents the asset’s definitive 2026 cycle bottom.
What do the Bybit and Binance XRP data differences mean?
The data split shows that Bybit traders are aggressively cutting risk and closing positions, while Binance traders are holding or adding exposure. This rare multi-exchange divergence indicates the market is completely split on XRP’s next move.
Is XRP oversold on the daily chart?
No, XRP is not yet technically oversold. While the Relative Strength Index (RSI) has dropped significantly to 33.31, it remains above the traditional oversold threshold of 30, meaning momentum still has room to slide downward.
What are the major resistance levels for XRP?
XRP faces heavy overhead resistance at its 50-day Simple Moving Average (SMA) of $1.3885 and its 100-day SMA of $1.3838. Price must reclaim these moving averages to invalidate the current bearish trend.
The information provided in this article is for educational purposes only and does not constitute financial, investment, or trading advice. Coindoo.com does not endorse or recommend any specific investment strategy or cryptocurrency. Always conduct your own research and consult with a licensed financial advisor before making any investment decisions.
The post XRP Is $0.12 Away From Its 2026 Bottom: What Traders Are Looking For appeared first on Coindoo.