During this crypto market crash, XRP price is actually doing fairly solid compared to some others. It is down around 18% this week, while Ethereum is down 22%. Still, XRP holders have little
During this crypto market crash, XRP price is actually doing fairly solid compared to some others. It is down around 18% this week, while Ethereum is down 22%. Still, XRP holders have little reason to be happy in 2026. The token has dropped from $3.65 to $1.10 – a 70% decline.
Now, crypto veteran CrediBULL warns that the correction is far from over. Local lows have been broken, and while a relief bounce may come, the ultimate bottom is likely lower.
CrediBULL’s Take: Local Lows Taken, More Downside Ahead
CrediBULL tweeted on June 5 that local range lows on XRP have been taken. He expects a move to range highs assuming the broader market gets some relief. But he urges caution. XRP/BTC still sits roughly 30% above his downside target, so he does not think this will be the ultimate bottom for XRP, even if price does bounce back to the local range highs.
Ultimately, he believes the XRP price will find its way to the high‑time‑frame demand zone marked in green on his chart. That is when he would consider buying – assuming XRP/BTC has also hit his target zone by that time.
He reminds traders that this correction is in the context of correcting an impulsive move that took XRP from $0.50 to around $3.60. A 7x rally in a short period required a deep correction to “digest” that move. While the current drop looks scary, it is a natural result of such a quick run‑up.
XRP Chart analysis:
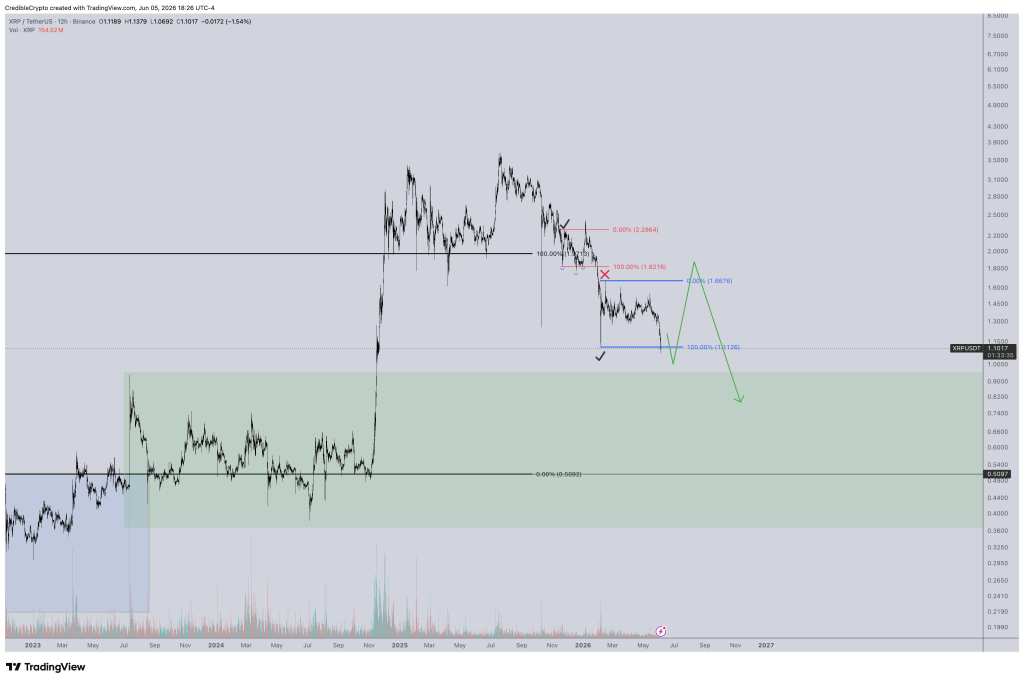
CrediBULL’s 12‑hour XRP/USDT chart from Binance shows a clear descending channel. Price has broken below the local range lows near $1.15‑$1.20 and is now trading around $1.10. The chart has multiple Fibonacci retracement levels drawn from the $0.50 low to the $3.60 high. The 61.8% retracement sits near $1.67, which was broken. The 78.6%
 Source: X/@CredibleCrypto
retracement is around $1.16 – also broken. The 88.7% retracement is near $0.85. CrediBULL’s green demand zone appears to be in the $0.50‑$0.60 area, which aligns with the 100% retracement level (back to the start of the move). The chart shows that XRP has been making lower highs and lower lows since the $3.60 peak. The structure is bearish.
Where Could XRP Price Go From Here? (Our Daily Analysis)
XRP price closed lower again yesterday. That marked the fifth straight day of losses as sellers continued to control the market, as we reported in our daily XRP price predictions for today. The decline pushed Ripple’s token back toward the important $1.0 support zone. This level has remained intact since November 2024, which makes it one of the most important price areas on the XRP chart. A break below $1.0 may not happen easily because it is a long‑term support.
Even so, the overall XRP price outlook remains bearish today. Any upward move that develops during the session would currently be viewed as a retracement unless XRP can reclaim higher resistance levels. The first important level sits near $1.21. A move above that area would weaken bearish pressure.
Stronger bullish conditions would require a break above $1.30. The broader bearish structure would only begin to lose strength if XRP eventually moves above $2.21.
A look at XRP’s momentum indicators shows that sellers still maintain an advantage. The Relative Strength Index currently stands at 30.949. That reading places XRP close to oversold territory and indicates continued weakness. The Stochastic Oscillator sits at 26.033.
This reading points to weak buying activity despite the recent support test. MACD remains negative at -0.053. That shows downward momentum continues to dominate price action. The Ultimate Oscillator is currently 36.37. Values below 50 typically indicate sellers still have greater control.
Read also: XRP Turned Early Buyers Into Millionaires Once: Why History Could Repeat in 6 Years
Our Opinion on CrediBULL’s XRP Warning
CrediBULL is one of the more respected technical analysts in crypto. His call that the correction is not over aligns with the price action we see. XRP has broken multiple support levels, and the indicators are firmly bearish. The $1.00 support is critical, but a break below it would open the door to $0.85 and then his green zone near $0.50‑$0.60.
That said, a 70% drop from the highs is already severe. Many assets bottom after such declines. CrediBULL’s target of $0.50‑$0.60 would represent a further 45‑55% drop from current levels. That is possible in a full‑blown bear market, but it is not guaranteed. The CLARITY Act, if passed, could change sentiment quickly. Also, Ripple’s infrastructure acquisitions (Hidden Road, GTreasury) may start generating real volume that supports the price.
For traders, the prudent approach is to wait for confirmation. A bounce to $1.30‑$1.50 is possible, but CrediBULL warns that would likely be a relief rally, not a new uptrend. The ultimate bottom may still be weeks or months away. Long‑term investors could start scaling in below $1.00, but they should be prepared for further downside. The XRP chart is not yet showing a reversal signal.
Subscribe to our YouTube channel for daily crypto updates, market insights, and expert analysis.
The post XRP Price Correction Far From Over: Local Lows Broken, More Downside Expected appeared first on CaptainAltcoin.