XRP price may finally be trying to leave its long downtrend behind. A new weekly chart shared by an analyst shows XRP breaking above the descending structure that had defined price action for
XRP price may finally be trying to leave its long downtrend behind.
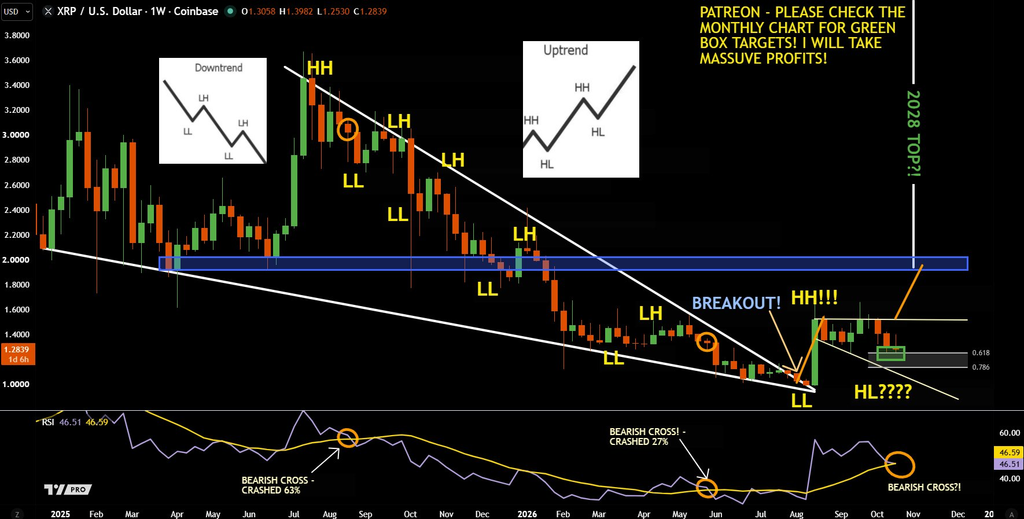
A new weekly chart shared by an analyst shows XRP breaking above the descending structure that had defined price action for months. The analyst’s main point is that XRP has already created a higher high, but the next pullback now needs to form a higher low if bulls want to confirm a genuine trend change.
That makes the current move much more interesting than a normal bounce.
XRP Has Finally Broken the Lower-High Structure
The XRP chart shows a long sequence of lower highs and lower lows from the 2025 peak near $3.40.
That pattern is the textbook definition of a downtrend.
Each rally failed below the previous high, and each selloff eventually produced another lower low.
The structure changed after XRP bottomed near the $1 area.
From there, price broke above the long descending trendline and rallied toward roughly $1.50.
The analyst labels that move as the first higher high.
That is the key change.
 Source: X/@jaydee_757
A downtrend does not become bullish just because price bounces. What matters is whether the market stops printing lower highs and lower lows.
XRP has now done the first part.
The second part is still missing.
The Higher Low Could Decide the Next Move
The analyst is now watching for a higher low.
The XRP chart marks a support area around the low-$1.20s, with Fibonacci levels near the 0.618 and 0.786 retracement zones.
XRP is currently around $1.28, which places price directly above that area.
If buyers defend this region and XRP turns higher, that would create the higher low the analyst wants to see.
That would give the market a much cleaner bullish structure:
higher high → higher low → another push higher.
The next clear resistance on the chart is around $1.50.
Above that, the larger blue resistance zone near $1.90-$2.00 becomes important.
The analyst also draws a path from a possible higher low toward that region.
That does not mean $2 is guaranteed.
It means the chart would become far more constructive if XRP holds the current support and then reclaims the $1.50 area.
Read also: How High Could XRP Price Go? These Setups Are Looking Beyond $5
RSI Sends a Warning
There is one part of the chart that bulls should not ignore.
Weekly RSI is around 46.5 and is close to crossing below its moving average.
The analyst marks this as a possible bearish cross.
Previous bearish RSI crosses on the chart were followed by notable declines, including one move labeled around 27% and another much larger drop.
That does not mean history has to repeat.
But it does mean XRP is not getting a clean bullish signal from momentum yet.
For me, this creates a very clear setup.
Price structure has improved, but momentum still needs to confirm it.
If XRP holds the low-$1.20s and RSI stabilizes, the bullish case gets much stronger.
If support fails and RSI rolls over further, the breakout could turn into another failed recovery.
My XRP Price Outlook
I would split the setup into three scenarios.
Scenario
XRP price path
Bullish
Hold $1.20-$1.25 → reclaim $1.50 → $1.90-$2.00
Neutral
Consolidation between $1.20 and $1.50
Bearish
Lose $1.20 → risk of a deeper retest toward $1.00
For more crypto news and price predictions, click here.
Subscribe to our YouTube channel for daily crypto updates, market insights, and expert analysis.
The post XRP Price Could Be Entering a New Structure! appeared first on CaptainAltcoin.