XRP price continues to near another breaking point, according to analyst Javon Marks. His long-term fractal projection indicates XRP is repeating the same accumulation structure that preceded
XRP price continues to near another breaking point, according to analyst Javon Marks.
His long-term fractal projection indicates XRP is repeating the same accumulation structure that preceded the 2017 bull run. If the pattern holds, the next leg up could push XRP toward $15 and above.
We are in a brutal bear market. XRP is stuck near $1.10. Most traders have given up on any meaningful rally. But Marks is looking at the bigger picture – a multi-year fractal that has been building since 2018.
The 2014–2017 Blueprint: How XRP Exploded
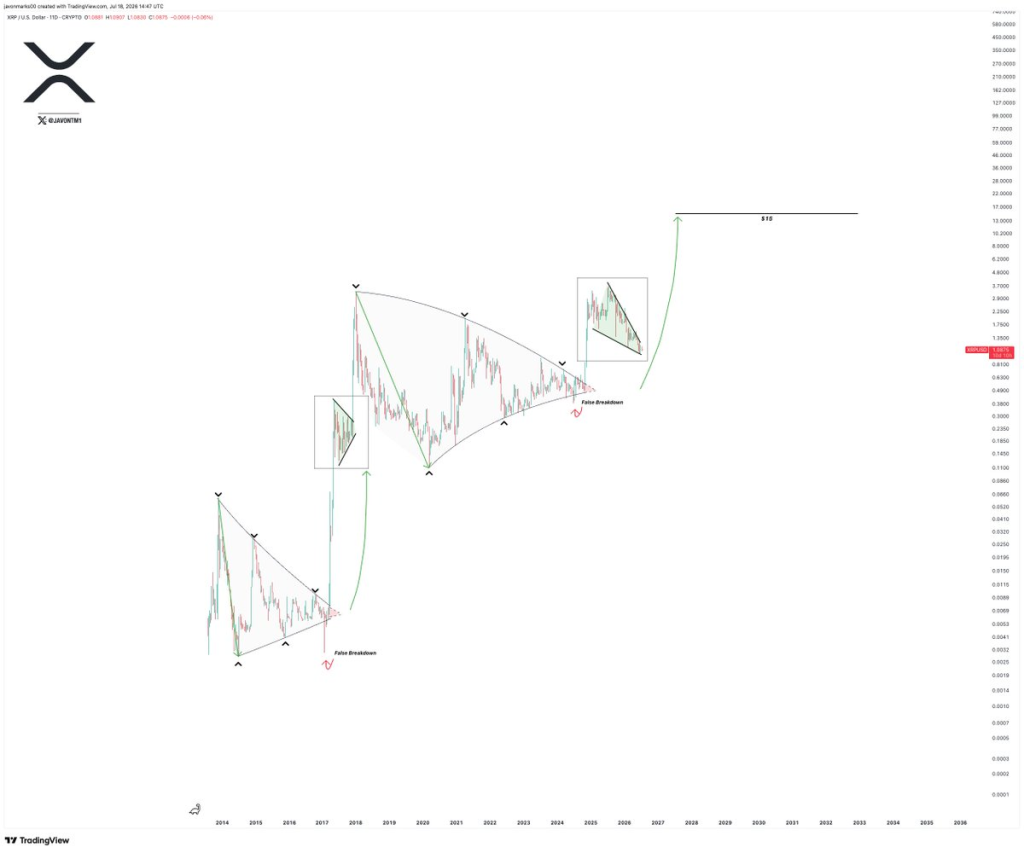
The left side of Marks’ chart shows XRP after its first major spike. The pattern is clear:
- Huge rally followed by lower highs, lower volatility, and a contracting triangle
- A false breakdown below support – a bear trap designed to shake out weak holders
- An immediate explosion that became the famous 2017 run from roughly $0.005 to over $3
That move turned early believers into millionaires. The question is whether the same structure is repeating.
 Source: X/@JavonTM1
The Current Cycle: A Near-Perfect Mirror
The right side of the XRP chart shows the exact same structure playing out since 2018.
- A massive bull run in 2017–2018
- Years of declining volatility
- Curved resistance that each rally touches (2018 peak, 2021 peak, 2024 peak)
- Rising support from higher lows – creating a squeeze between falling supply and rising demand
- A current bull flag formation with shrinking volatility
The chart indicates that the XRP price has already completed the false breakdown. That is the most important assumption. If the fractal holds, the next move is explosive.
Read also: ChatGPT Predicts Whether $10,000 Is Better Invested in XRP or Bitcoin
The False Breakdown and the $15 Target
Marks expects the XRP price to briefly fall below support before reversing upward. This is consistent with the 2017 fractal.
The important part: don’t panic if XRP dips one more time. According to the fractal, that final shakeout would be the buying opportunity.
After the breakout, the projection is almost vertical. $15 is the target – roughly a 15x move from current levels.
Is $15 impossible? No. XRP reached $3.84 during the last cycle. During another euphoric crypto cycle, $10–15 is not impossible.
However, the move would require substantially more capital than in 2017 because the circulating supply has increased and liquidity requirements are higher.
My Honest Take on This XRP Price Prediction
The fractal analysis is compelling. Marks correctly identifies real technical concepts: multi-year accumulation, bull flags, descending resistance, false breakouts, and XRP’s historical tendency for explosive delayed rallies.
But fractals are not guarantees. The pattern could break down. The false breakdown could become a real breakdown.
For traders, the key level is the false breakdown support. If the XRP price holds that level and reverses, the upside potential is enormous. If it breaks for real, the fractal is invalidated.
I am not calling a bottom. But Marks’ chart is the most interesting XRP analysis I have seen in weeks. A move to $15 is not impossible – just unlikely in the short term.
Subscribe to our YouTube channel for daily crypto updates, market insights, and expert analysis.
The post XRP Price Is Repeating a Pattern That Led to the 2017 Explosion! appeared first on CaptainAltcoin.